 Guido Mieth
While equities continued to piece together an impressive weekly win streak that ended with slight losses across the major indexes on Tuesday, it is getting more and more clear that the U.S. economy is slowing. My current view is that the country will be in at least a shallow recession no later than the first half of 2025. With the market selling at 22 times forward earnings on the S&P 500 and at a price-to-sales ratio rarely if ever seen (among other valuation metrics like price-to-book showing the same extreme valuations), investors are clearly not positioned for this potential economic scenario.
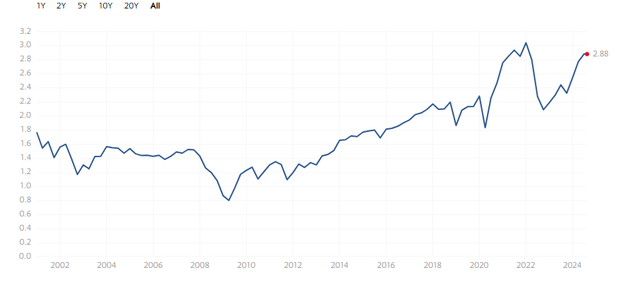 Price to sales ratio – S&P 500 (Multpl)
So, today, we will take a look at five signals showing that key portions of the economy are clearly deteriorating.
Unemployment Rate:
Let’s start with an obvious sign of increasing economic duress, the rising unemployment rate. The U.S. unemployment rate has quickly (from a historical perspective) moved from 3.5% last July to 4.3% in the July 2024 BLS report.
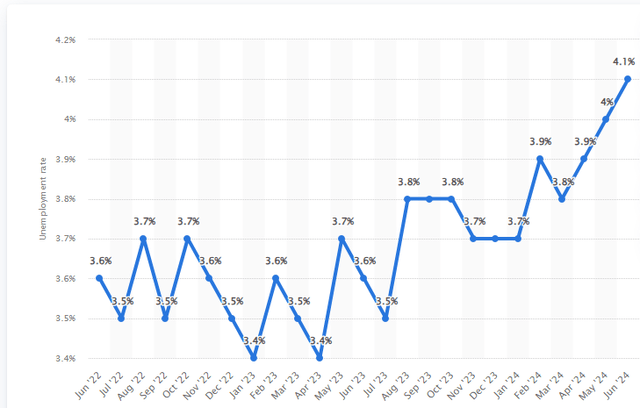 U.S. Monthly Unemployment Rate (Statista)
This move has triggered the so-called Sahm Rule that has been violated prior to every recession since the 1950s. Investors will get another key data point on September 6th when the Bureau of Labor Statistics puts out the jobs report for August. I am personally hoping that Hurricane Beryl in July was one of the reasons only a paltry 114,000 positions (consensus was for 174,000) were created in July, and we see a rebound in August. The NY Fed reported earlier this week, however, that ‘the share of individuals who said they’re searching for a job in the past four weeks rose to 28.4%, the highest level since March 2014, and up from 19.4% in July 2023.‘
GDP Growth Has Slowed Substantially:
The federal government has run a fiscal deficit north of six percent of GDP both in FY2023 and, so far, in FY2024 ($1.52 trillion for the first ten months of the government’s fiscal year). With the debt to GDP ratio already at the highest levels in U.S. history, this is clearly unsustainable. Future administrations will either have to raise taxes and/or cut spending growth rates. The tax cuts legislated in 2017 are also set to expire in 2025. Higher taxes and/or lower levels of spending will be headwinds for the economy at that point.
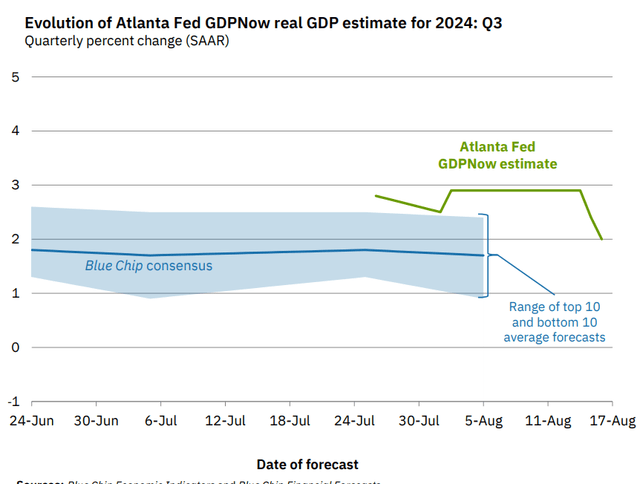 Atlanta Fed GDPNow
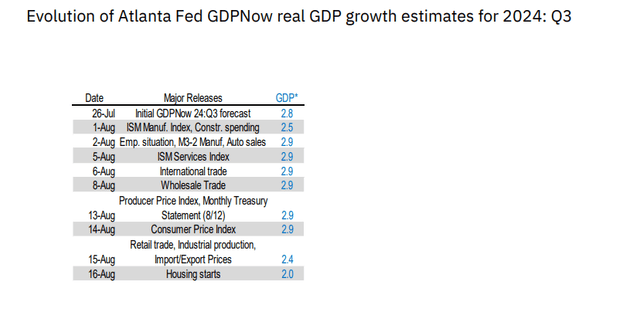 Atlanta Fed GDPNow
Keep your eye on how much the Government is spending, because that is the true tax.” – Milton Friedman
It was one thing when all this taxpayer largess was driving significant economic growth, and GDP growth was north of four percent in the back half of 2023. However, that growth has slowed substantially here in 2024, with GDP growth of 1.4% in Q1 and an initial estimate of Q2 GDP of 2.8%. Currently, the Conference Board only sees 0.6% annualized GDP growth in Q3 and 1.0% in Q4. The Atlanta Fed’s GDPNow is calling for higher third quarter growth than the Conference Board, but that estimate was revised down sharply a few days ago.
Leading Economic Indicators:
On Monday, the U.S. Leading Economic Indicators or LEI were down for the 28th of the last 29 months. This is another historical indicator that has had a solid record of predicting coming recessions. The indicator has had a definite lag this time around. My guess is that is because of the trillions of dollars Congress has pumped into the economy with Covid stimulus programs and massive infrastructure spending packages.
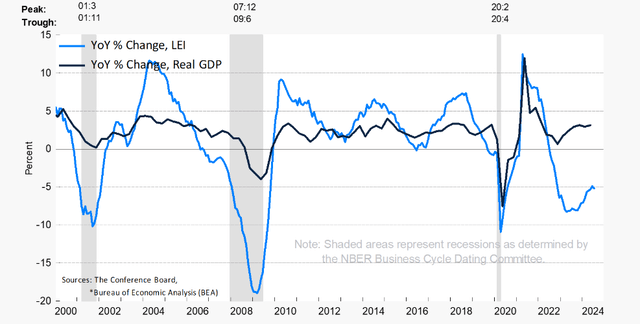 Conference Board
This month’s negative LEI reading was primarily caused by ‘a sharp deterioration in new orders, persistently weak consumer expectations of business conditions, and softer building permits and hours worked in manufacturing drove the decline, together with the still-negative yield spread‘
More Signs Of Consumer Distress:
The lower and middle-income consumer has been under pressure all through 2024 which has been manifested in poor guidance in both the first and second quarters from the likes of Home Depot (HD), Starbucks (SBUX), Loews Corporation (LOW), McDonald’s Corporation (MCD), Macy’s (M), Nike (NKE) and myriad other well-known consumer focused names.
However, recently, areas of strength in consumer spending are starting to show some cracks. E-Commerce sales in the second quarter were up only 1.3% on a quarter-over-quarter basis, following a 2.1% gain in the first quarter of this year. CNBC just posted a story on how demand for travel spending, which has been more than robust for over two years, seems to be ebbing.
 Federal Reserve Bank of St. Louis
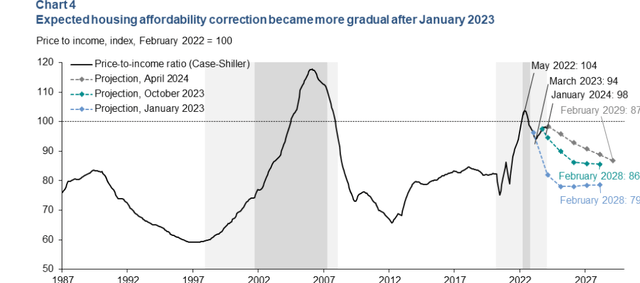
Finally, the lowest mortgage rates in more than a year aren’t helping the housing sector yet. Housing starts dropped 16% on a year-over-year basis in July. Existing home sales also had their poorest July since Redfin started tracking this metric in 2012. Housing Affordability is still near historical lows, outside the peak of the Housing Boom in 2006.
The Yield Curve:
The Treasury yield curve has been consistently inverted since the early summer of 2022. The last time the yield curve was inverted for this long of a duration ran into 1929. Let’s say that it did not end well for investors. In addition, the divergence between the two and ten-year Treasury yield hit their highest level since 1981, when the U.S. was in the middle of a brutal double deep recession, in July 2023. This is another historically reliable indicator of an upcoming recession, whose ‘lag’ has likely been extended significantly by the excess trillions of dollars thrown at the economy by the administration and Congress in recent years.
However, the yield curve has started to significantly un-invert in recent months. After peaking at just under 110 basis points in the summer of 2023, the divergence between the two- and ten-year treasury is currently less than 20 bps. They will likely normalize completely before the end of the year as the Chairman Powell starts to cut the Fed Funds rate, which is expected to begin at the September FOMC meeting. The 10-Year and 30-Year Treasury yields have been normalized for some time now.
Investors appear to be banking on rate cuts to re-energize the economy and further boost the markets. However, rate cuts are unlikely to be the panacea they are hoping for. A recent decline of more than one percent on the average 30-Year mortgage rate has done nothing to revitalize the housing sector to this point, after all.
 Forbes
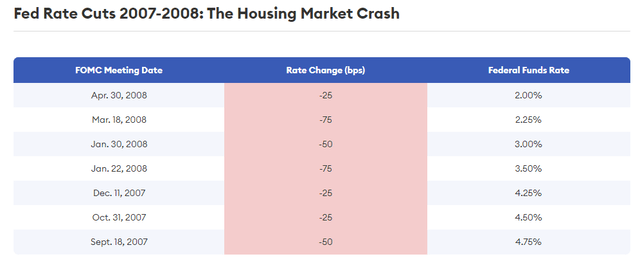
In addition, the start of cutting rates has notably happened in front of some historical bear markets, especially when the economy is decelerating, like it is now. The Fed started to cut rates from almost identical levels in September 2007, just months before the Great Financial Crisis of 2008/2009.
 Forbes
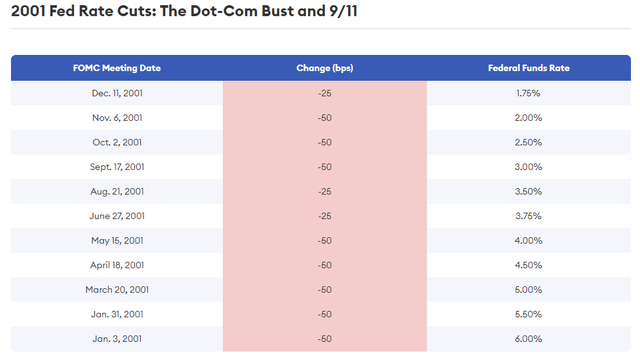
The central bank also started to cut rates at the beginning of 2001, when the market was in the midst of the Internet Bust. The market did not bottom until late September 2022. From peak to trough, the NASDAQ lost over 80% of its value during this era.
You simply can’t raise rates the most in recent history at the fastest pace in recent history on the most debt outstanding in history and not face consequences.” – ZeroHedge
I have used the above quote from a ZeroHedge article earlier this month a few times in recent articles. I think it captures the complacency of the markets given the huge explosion of debt in recent years and investors’ hopes that we are going to get out of this predicament without paying the piper. I just don’t believe that is going to happen, especially with the economy clearly slowing. Prudent investors should position their portfolios accordingly.
Shared by Golden State Mint on GoldenStateMint.com


