Source: www.stockcharts.com
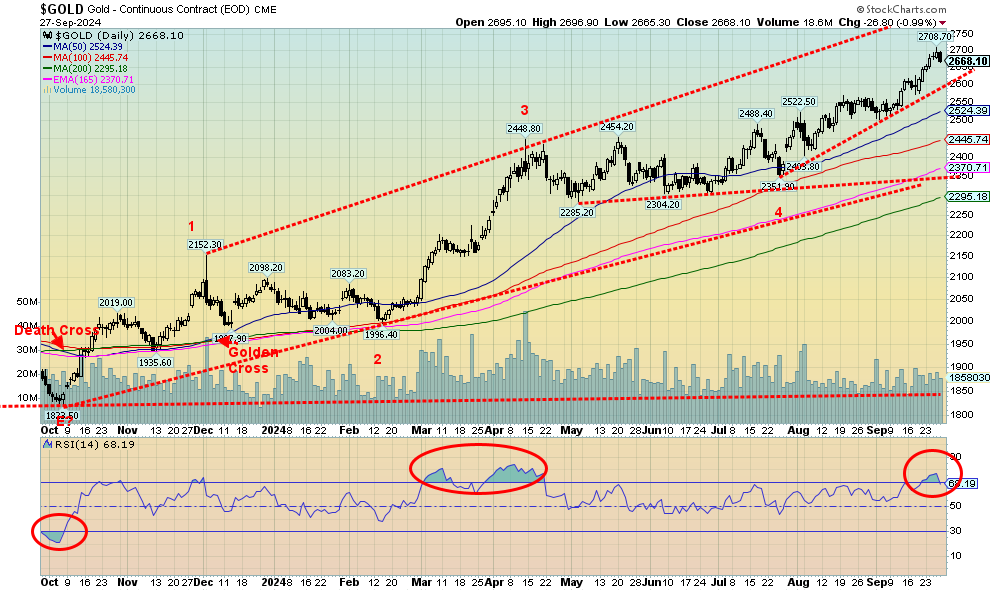
Gold keeps churning higher to new all-time highs. Yes, once again, gold made all-time highs with Thursday’s high at $2,708.70. Gold has had a good year. Currently up 34.2% in 2024, if it holds it would be best year since 1979, the year gold took off into the stratosphere, gaining 134.8%. Before that the best year was 1978 with a gain of 36.5%. In 2010 gold gained 29.8%. This time the Fed cutting rates helped spur the current round of buying. As well the US$ Index recently hit new 52-week lows, also helping gold. Geopolitical uncertainty, domestic political uncertainty, monstrous debt, central bank demand, strong buying out of Asia, China’s stimulus package, and waning confidence in all governments are helping the rise of gold. We also note that fund managers and hedge funds are waking up to having more gold in their portfolios.
After making its all-time high on Thursday, gold reversed on Friday and fell on what appears as profit-taking as no recent news shook it. The US$ Index was down and PCE prices were also down. We are also overbought with the RSI moving over 70. However, as we saw back in March/April, overbought can hang around for some time. Will events in the Middle East on the weekend spark a new rise as the region races towards all-out war? Or do we await the nonfarm payrolls on Friday to see what the Fed might be up to next? The Fed has two meetings left in November and December and a minimum further 50 bp cut is likely, but could it be a 100 bp?
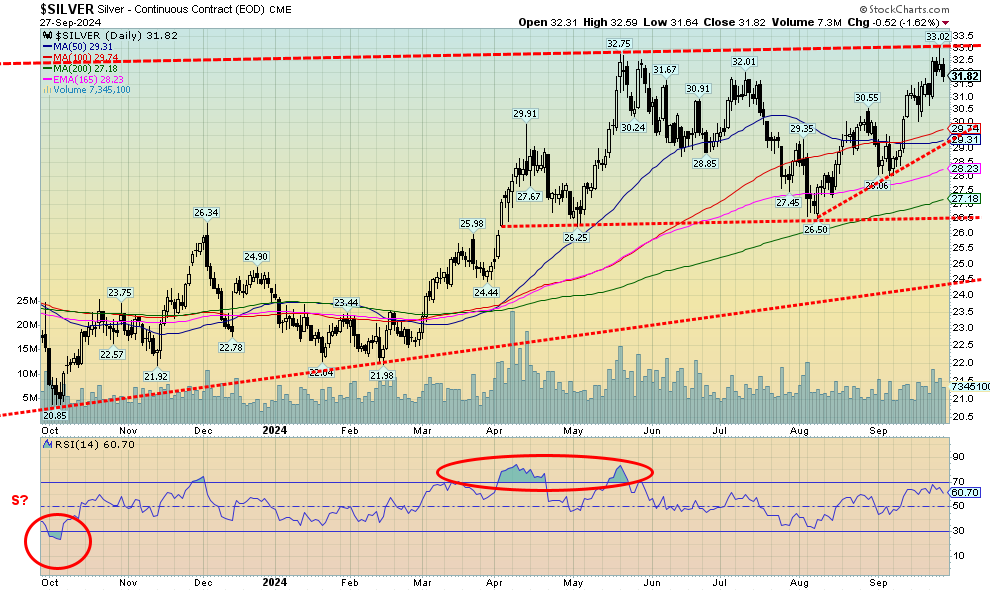
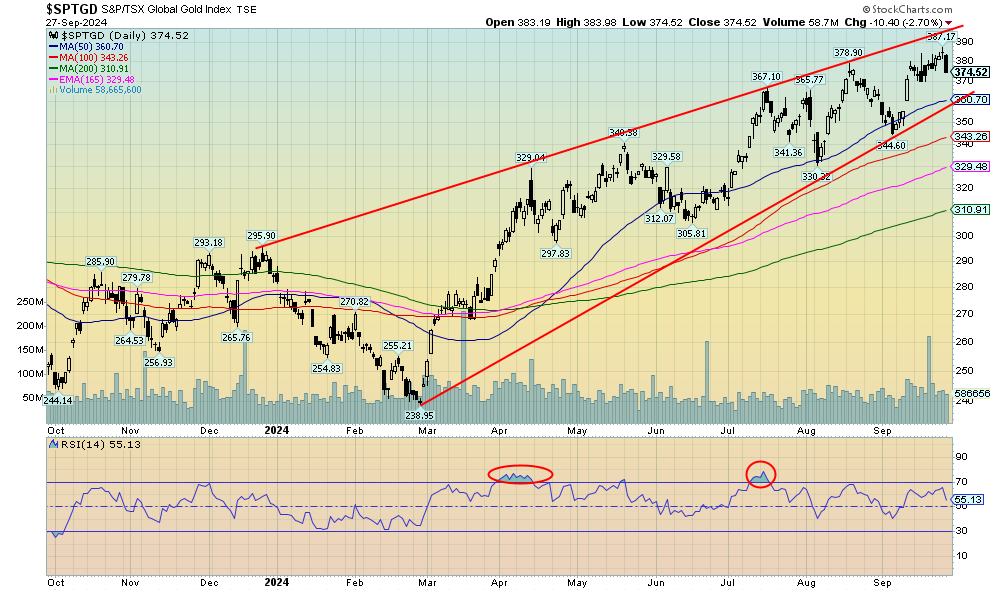
On the week, gold rose 0.8%, silver was up 1.0% to 52-week highs and the highest level since 2012, platinum recovered a bit, up 4.1%, but palladium stumbled, down 5.1%, while copper soared on Chinese stimulus, up 6.0%. However, the gold stocks hesitated as the Gold Bugs Index (HUI) fell 0.7% and the TSX Gold Index (TGD) was down 1.1% after both made 52-week highs.
Gold has been in a steady uptrend with only shallow pullbacks since breaking above that consolidation pattern that we believe was an ascending triangle. Since July, we have soared to all-time highs. So, is this another shallow pullback or might we pull back even more? A break under $2,600 might interrupt the magic. Under $2,500 we could move lower and under $2,400, and especially under $2,300, the up move would be officially over. First let’s hold above $2,600.

Source: www.stockcharts.com
Silver finally broke through to new 52-week highs, but it was short-lived. Silver this past week jumped to a high of $33.02, surpassing the May high of $32.75. But just as soon as one could say “new high”, silver reversed and closed at $31.82. False move? We don’t think so, but a longer connecting line with that May high does come in just above $33. That’s another hurdle to overtake if we are to fulfill targets up at $38–$40. Many think we’ll go even higher, but let’s get to those targets first. Silver has considerable support down to $29, but we wouldn’t want to see a break under that level as that would signal further losses, possibly down to $26. The good news this week was that silver did gain 1.0%. But it was insufficient to burst through $33 resistance. Now we await the nonfarm payrolls on Friday to possibly point to the next direction. However, October is not noted for being a prime time for gold and silver, with tops in September followed by choppy weakness into December before the next good up leg gets underway. Will this year be different?

Source: www.stockcharts.com
The gold stock indices once again made 52-week highs, but then promptly saw a wave of profit-taking on Friday, pushing both indices into the red. On the week, the TSX Gold Index (TGD) lost 1.1% while the Gold Bugs Index (HUI) was down 0.7%. A reversal? Yes, but not a key one. However, it may signal another period of consolidation. We would not want to see the TGD break under 360 and definitely not under 345. Both could be signaling that a more important top is in. There is still room to maneuver higher within the channel. The channel goes up to at least 400. But Friday’s move to the downside might set up at least a week of waffling as we go into next Friday’s anxiously awaited nonfarm payrolls.
Disclaimer
David Chapman is not a registered advisory service and is not an exempt market dealer (EMD) nor a licensed financial advisor. He does not and cannot give individualized market advice. David Chapman has worked in the financial industry for over 40 years including large financial corporations, banks, and investment dealers. The information in this newsletter is intended only for informational and educational purposes. It should not be construed as an offer, a solicitation of an offer or sale of any security. Every effort is made to provide accurate and complete information. However, we cannot guarantee that there will be no errors. We make no claims, promises or guarantees about the accuracy, completeness, or adequacy of the contents of this commentary and expressly disclaim liability for errors and omissions in the contents of this commentary. David Chapman will always use his best efforts to ensure the accuracy and timeliness of all information. The reader assumes all risk when trading in securities and David Chapman advises consulting a licensed professional financial advisor or portfolio manager such as Enriched Investing Incorporated before proceeding with any trade or idea presented in this newsletter. David Chapman may own shares in companies mentioned in this newsletter. Before making an investment, prospective investors should review each security’s offering documents which summarize the objectives, fees, expenses and associated risks. David Chapman shares his ideas and opinions for informational and educational purposes only and expects the reader to perform due diligence before considering a position in any security. That includes consulting with your own licensed professional financial advisor such as Enriched Investing Incorporated. Performance is not guaranteed, values change frequently, and past performance may not be repeated.
Shared by Golden State Mint on GoldenStateMint.com


