Summary
- The recent high in GLD exhibited a blow-off top, characterized by a rapid price surge to $257 followed by a sharp sell-off to $236.1.
- Our two intermediate-term sentiment indicators, the “puts to calls” ratio in GLD and the Hulbert Gold Survey, signal caution and suggest an end to the two-year bull market in GLD.
- Excessive optimism in GLD call options and bullish sentiment from gold advisors indicate the potential for lower prices; we recommend waiting for pessimism to build.

Annabelle Breakey/DigitalVision via Getty Images
Just as some bear markets end in selling climaxes, some bull markets end in price blow-offs. A selling climax is driven by panic selling; blow-offs are driven by panic buying and short covering.
The recent high in SPDR® Gold Shares ETF (NYSEARCA:GLD) had all the characteristics of a blow-off top. There was a price surge to $257 followed by a sharp sell-off to $236 that retraced most of the price surge.
The interesting thing is the likelihood of a gold blow-off was predicted a month ago.
The picture below is a photocopy of the Sentiment King Gold report of November 2nd. It explains the rationale behind a possible blow-off and gives a forecast of $2,500 for gold after the expected sell-off.
In fact, gold did reach a low of $2,556 on November 15th.
Photo Copy of the Sentiment King November 2nd Gold Report (The Sentiment King)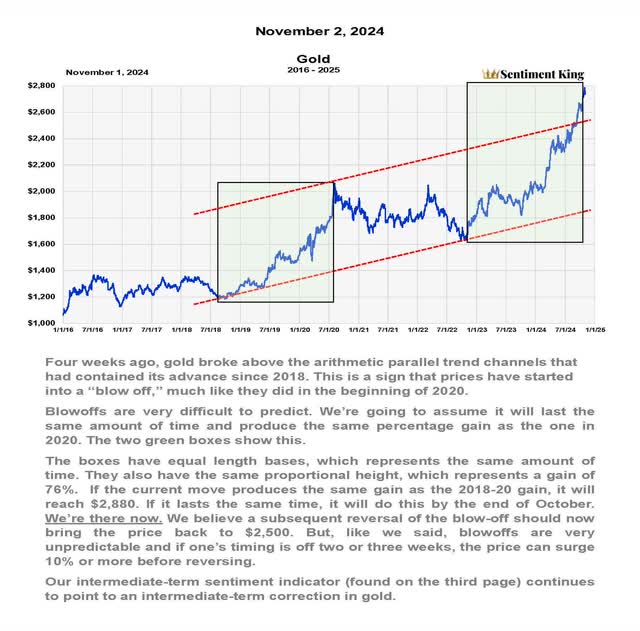
This next chart shows what happened over the following month. We’ve indicated the possible blow-off with a red oval. It has all the characteristics of a blow-off – a rapid price surge followed by a sharp sell-off that reverses the gain. The strong rally after the deep selloff is also somewhat normal with a blow-off.
The important question is: was it actually a blow-off top?
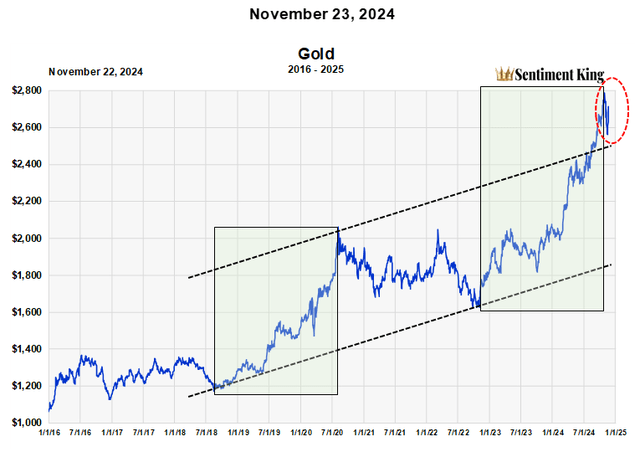
A Chart of Gold With A Red Oval Showing the Possible Price Blowoff (The Sentiment King)
Two Indicators Of Investor Sentiment Point To The End Of The Two-Year Bull Market In GLD
In our gold report, we said: “Our intermediate-term sentiment indicator continues to point to an intermediate-term correction in gold.”
(We must also be accurate and say that these same indicators pointed to a top in August, which we wrote about in this article. We did miss most of this final blow-off leg, which ran from August to the end of October since we sold all our GLD and went 100% into cash in September).
Our intermediate-term sentiment indicator for gold is a composite indicator made from two other indicators – the ratio of “puts to calls” money going into GLD, and the Hulbert Gold Survey. Let’s look at each in turn.
There Was Too Much Money Going Into GLD Call Options
The “puts to calls” ratio is a wonderful sentiment indicator for the stock market. It’s well known that when “too many” investors buy calls expecting prices to rise, they generally decline and vice versa. This is very true of gold too. By comparing how much money is going into GLD “calls” versus GLD “puts”, we gain insight into whether investors expect GLD to rise or fall.
When “too much” money is buying GLD “calls” compared to GLD “puts”, it represents “too much” optimism, and one can expect lower prices. We call those Red Zone readings. We’ve indicated using red arrows five of them since 2020. They each indicated intermediate-term price highs in gold.
The latest one is the most troubling, however, since Red Zone readings occurred five or six times during the last six months. This didn’t occur at the four other extremes. All we can say is, no indicator is perfect.
Notice that the ratio has now moved into the middle of the range since the recent sell-off. We believe it’s best to remain cautious on gold until pessimism builds again, and we get a Green Zone reading.
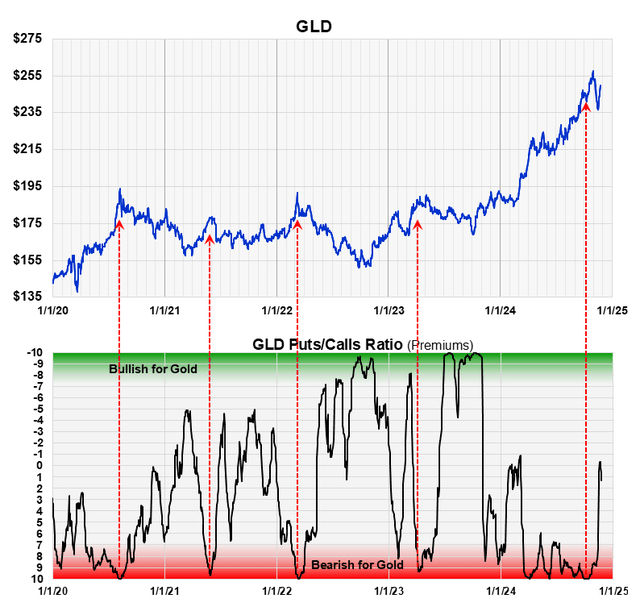
The Puts to Calls Ratio Of Money Going Into GLD Over Twenty Days Plotted On The Sentiment King Ranking Scale (The Sentiment King)
The Gold Survey Is Improving, But It’s Still “Too Bullish”
The chart below shows the Sentiment King ranking of the Hubert survey of gold advisors and newsletter writers. Like all surveys, it acts as a contrary opinion indicator. When too many advisors and writers are bullish on gold, prices are generally at a peak.
We’ve circled in red three times in the last 20 years when there were extreme levels of bullish optimism from gold newsletter writers. These are Red Zone readings which are bearish for gold. As you can see, the first two signaled major price peaks in gold. We believe this third event marked another important top in GLD.
While our ranking of the Hulbert Survey has just moved out of the Red Zone, it is still a long way from another Green Zone reading. Like with the “puts to calls ratio” we believe it’s best to remain cautious on GLD until pessimism builds, and we get a Green Zone reading from the survey.
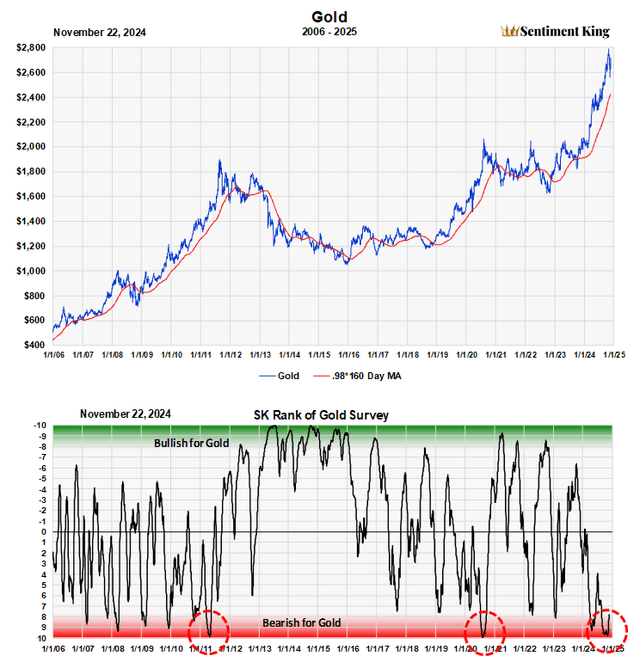
The Hulbert Survey Of Gold Newsletter Writers Put on the Sentiment King Ranking Scale. (The Sentiment King)
Conclusion
We believe GLD experienced a blow-off top at the start of November. It has now started an intermediate-term correction that will last at least a few months. We think it is too early to invest in GLD after the sell-off, and recommend waiting until investor sentiment has turned bearish again.
Shared by Golden State Mint on GoldenStateMint.com


