Summary
- Markets plunged late last week as new U.S. reciprocal tariffs were disclosed after the bell on Wednesday.
- The NASDAQ and the Russell 2000 are now in an official bear market territory, and the S&P 500 had its worst week since the COVID pandemic.
- The VIX spiked to its highest levels in five years, and oil dropped like a rock late in the week.
- Where valuation levels now stand in a historical context and what I am doing as equities fall hard, is discussed in the paragraphs below.
- I am Bret Jensen, an analyst with years of experience in the biotech sector. I lead the investing group The Biotech Forum where we focus on proprietary, breaking research on biotech and biopharma stocks.

iantfoto
For several quarters now, I have been quite pessimistic about the overall markets. The outcome of the November election changed little around that view. I have put out dozens of articles highlighting my pessimism around the equity markets both here on Seeking Alpha and at Real Money Pro throughout most of 2024 and consistently in 2025. My concerns have been primarily focused on valuation levels, as well as worries about ‘sticky‘ inflation, fading consumer confidence as well as the clear deterioration in the residential and commercial real estate sectors.
AAPL Stock Chart (Seeking Alpha)
Recently, the increasing chances of a trade war crept into my analysis, like my recent article around Apple (AAPL), where that was one of 3 reasons the stock was a clear avoid. For this consistent body of work, I have been labeled as a ‘permabear‘ (and much worse) by numerous Seeking Alpha and Real Money Pro followers. However, that investing patience and discipline has started to pay off in a big way as far as my portfolio returns. My overall portfolio is down for the year, but with a fraction of the overall market’s loss.
VIX Stock Chart (Seeking Alpha)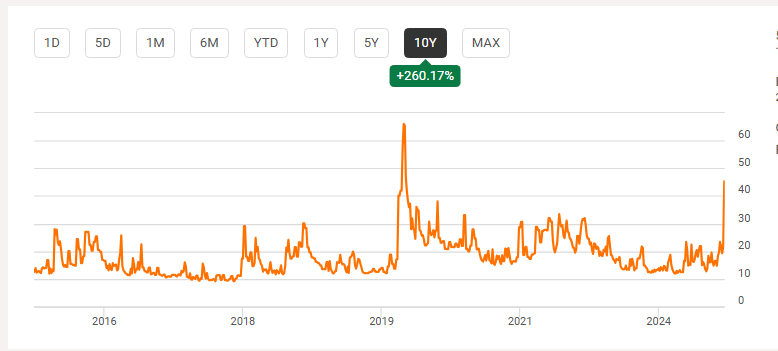
Last week, investors got taken out to the woodshed and beat like a rented mule. The S&P 500 fell nine percent on the week, its worst week since the start of the Covid lockdowns. The S&P VIX Index (VIX) moved up to the 45 level for the first time since the pandemic, as well as panic, seized the market. Both the NASDAQ and Russell 2000 are now in official bear market territory. The S&P 500 is not far behind with a loss of 17% so far in 2025.
The rollout of reciprocal tariffs after the bell on Wednesday was the primary trigger for the huge sell-off late last week. And indeed, they were ‘non-optimal‘ to understate things. Or as I described them in my Friday column on Real Money Pro ‘reciprocal tariff percentages against individual countries utilizing trade imbalances were nonsensical, beyond excessive, ham-handed and frankly, economically asinine‘.
U.S. Trade Deficit in Billions of Dollars (Macrotrends)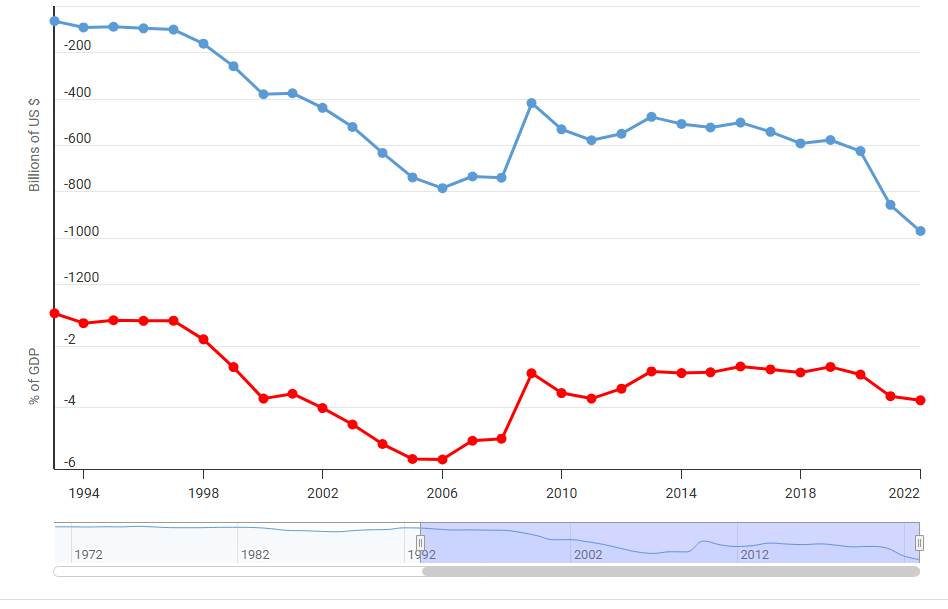
One can make the case the United States has been getting the short end of the stick on my many fronts in regard to global trade policies for a generation or two. The U.S. Trade Deficit with the rest of the world in 1991, before NAFTA and China was ushered into the WTO, was just over $65 billion. Last year, it was approximately $1.2 trillion. In 1991, the U.S. had an $28 billion surplus in advanced technology manufacturing with the world. That has reversed to a $300 billion deficit as of last year.
Wolf Research, World Bank, Zero Hedge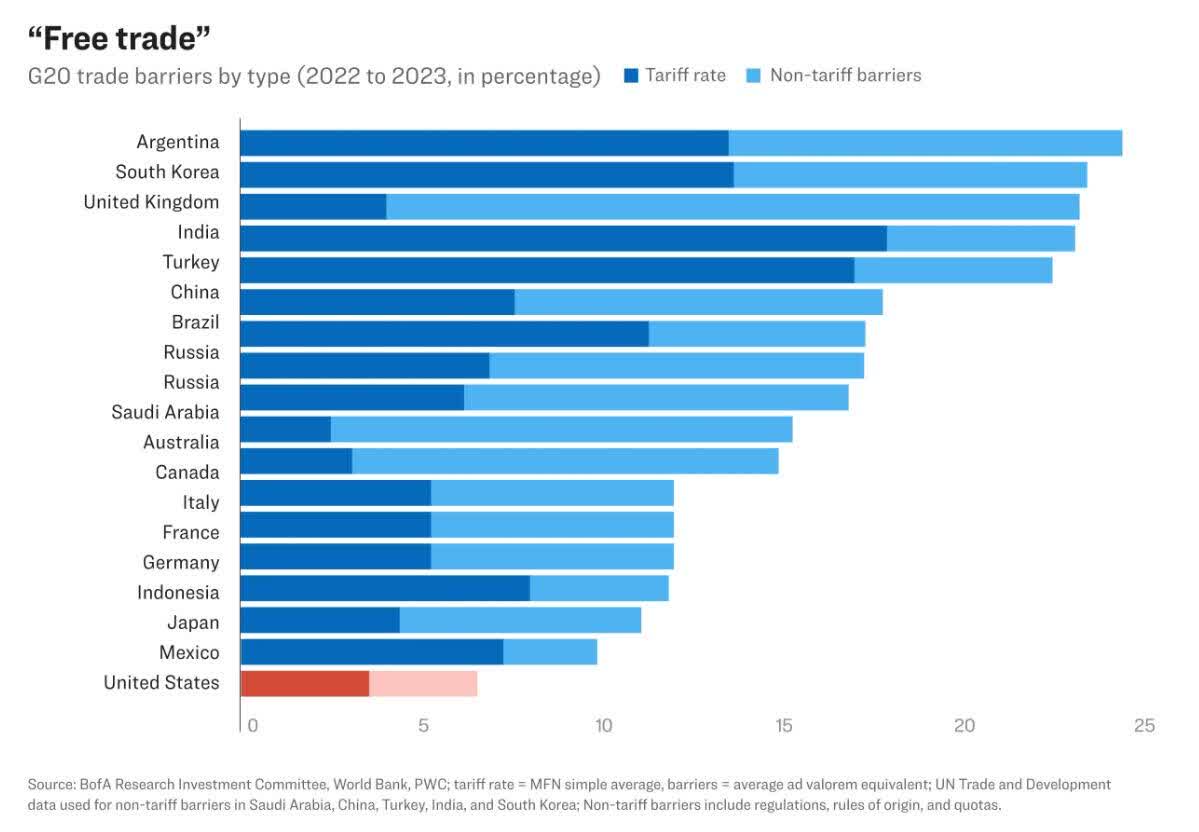
That said, if the U.S. wanted reciprocal tariffs to match that of other G20 countries, it would look more like the chart above than what was announced on Wednesday. Hopefully, many ‘adjustments‘ are made to tariff policies in the weeks and months ahead. However, the fact that this latest bear market has been set off by new tariff policies is irrelevant in the scheme of things.
Equities came into 2025 being extremely overextended utilizing numerous valuation metrics. If it wasn’t tariffs, it would have been some other policy change, economic hiccup or geopolitical event that would have kicked off a huge reset in the markets at some point on the nearer term horizon. In addition, federal spending has gone from $4 trillion in FY2019 to nearly $7 trillion in FY2024, which included $1.16 trillion to service what is now an approximate $37 trillion U.S. government debt load. And in the last couple of years, the U.S. government has run a fiscal deficit of six to seven percent of GDP while the country was generating two to three percent GDP growth (and yes, government spending is including in those GDP calculations). This was always unsustainable.
S&P 500 price to sales ratio (Multpl)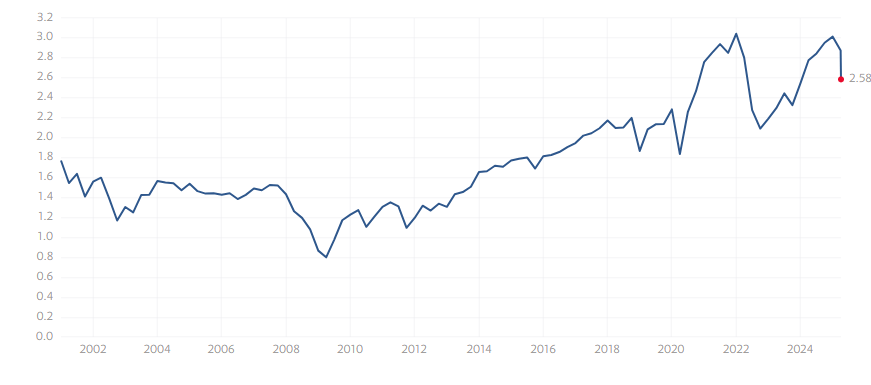
Just how overvalued had equities become by the end of 2024? The S&P 500’s price to sales ratio topped 3 for any the second time in its history (the first was just before the big market selloff in 2022) in December. Even with the recent sell-off, the index would have to fall roughly 20% to get down to the valuation level at the very tail end of the Internet Boom in early 2000.
And the market and the economy were in a much different place at the turn of the 21st century. The Baby Boom generation was in their prime earning years and the federal debt was just under $6 trillion after running a small surplus in 1999. The U.S. was coming off of four straight years of four percent GDP growth from 1996-1999. The Cold War had been won, and it was a unipolar world. Despite all of that, equity levels could not be sustained at those valuations. Before the Internet Bust was over and stocks hit bottom in the summer of 2002, the S&P 500 had shed just over 40% of its value, peak to troughs. The tech-heavy NASDAQ fell more than 80%.
Shiller P/E Ratio (Multpl)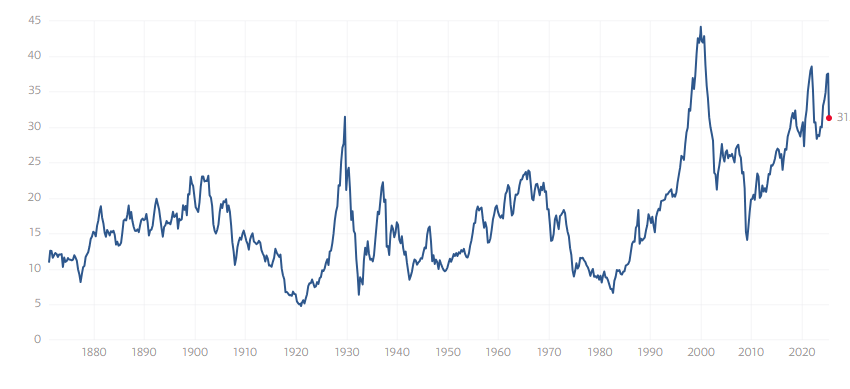
To get back down to the valuation levels on this metric at the end of President Obama’s two terms and the start of President Trump’s first term in 2017, the S&P 500 would have to drop an additional 25% to put things in perspective. The index would have to fall another 10% to get down to the valuation levels just before the start of the COVID panic in early 2020. In should be noted, that using other valuation metrics like the Shiller P/E ratio or U.S. Market Cap to GDP ratio yields similar conclusions.
U.S. Market Cap to GDP ratio (GuruFocus)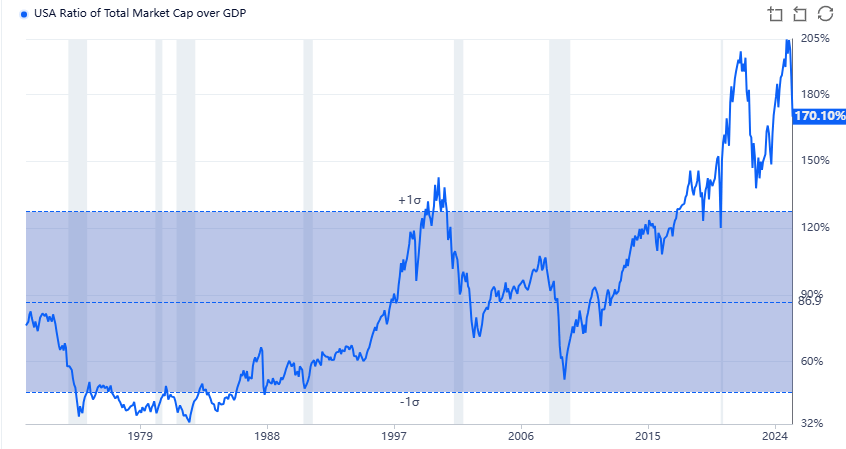
This means the market could easily sell off further to reach more realistic valuation levels in the weeks and months ahead. Equities could also stabilize, at least temporarily, if there are significant moves on the trade front that the market views as positive. Ending on a brighter note, investors who have a significant amount of ‘dry powder‘ in their portfolios, now have much lower entry points to put some of that ammo to work incrementally.
This is what I am doing using covered call orders around stocks and ETFs that sport reasonable valuations as my large hoard of short-term treasuries redeem throughout April and May. My last trade near market close on Friday is demonstrative of this approach.
XLE Stock Chart (Seeking Alpha)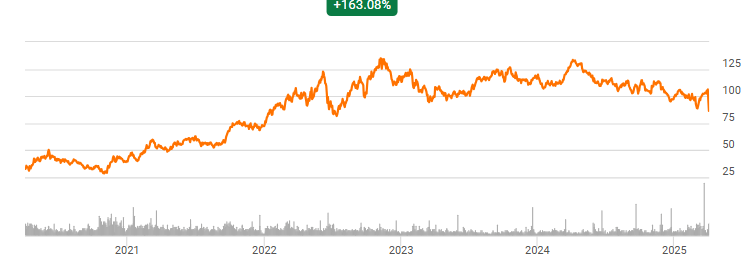
I used some covered call orders using long-dated options with strike prices a bit under the trading level of The Energy Select Sector SPDR® Fund ETF (XLE). This sector ETF plunged late in the week as oil fell by 15% on Thursday and Friday. The XLE’s largest holdings include the likes of ConocoPhillips (COP) and Exxon Mobil (XOM). The ETF now sells at its lowest levels since late 2023 and yields north of 3.6% as well.
And that is my updated view around equities, as markets begin another turbulent trading week.
Live Chat on The Biotech Forum has been dominated by discussion of these type of buy-write opportunities over the past several trading sessions. To see what I and the other season biotech investors are targeting as trading ideas real-time, just initiate your two-week no obligation free trial into The Biotech Forum.
Analyst’s Disclosure: I/we have a beneficial long position in the shares of XLE either through stock ownership, options, or other derivatives. I wrote this article myself, and it expresses my own opinions. I am not receiving compensation for it (other than from Seeking Alpha). I have no business relationship with any company whose stock is mentioned in this article.
Seeking Alpha’s Disclosure: Past performance is no guarantee of future results. No recommendation or advice is being given as to whether any investment is suitable for a particular investor. Any views or opinions expressed above may not reflect those of Seeking Alpha as a whole. Seeking Alpha is not a licensed securities dealer, broker or US investment adviser or investment bank. Our analysts are third party authors that include both professional investors and individual investors who may not be licensed or certified by any institute or regulatory body.
Shared by Golden State Mint on GoldenStateMint.com