Gold is in a clearly powerful bull market, and now is the time to trade with the trend and let your winners run.
")
I periodically like to step back and assess where gold stands when priced in the world’s major currencies—especially after a significant move like we’ve just seen. Looking at gold priced in multiple currencies, rather than just U.S. dollars, helps strip out currency bias and gives a clearer picture of gold’s true intrinsic strength. This approach has proven valuable over the past year—in both September and January, for example—helping me stay confidently bullish on gold even as critics repeatedly called it overbought and predicted a pullback. So with that in mind, let’s take a look at where gold currently stands across the globe’s major currencies.
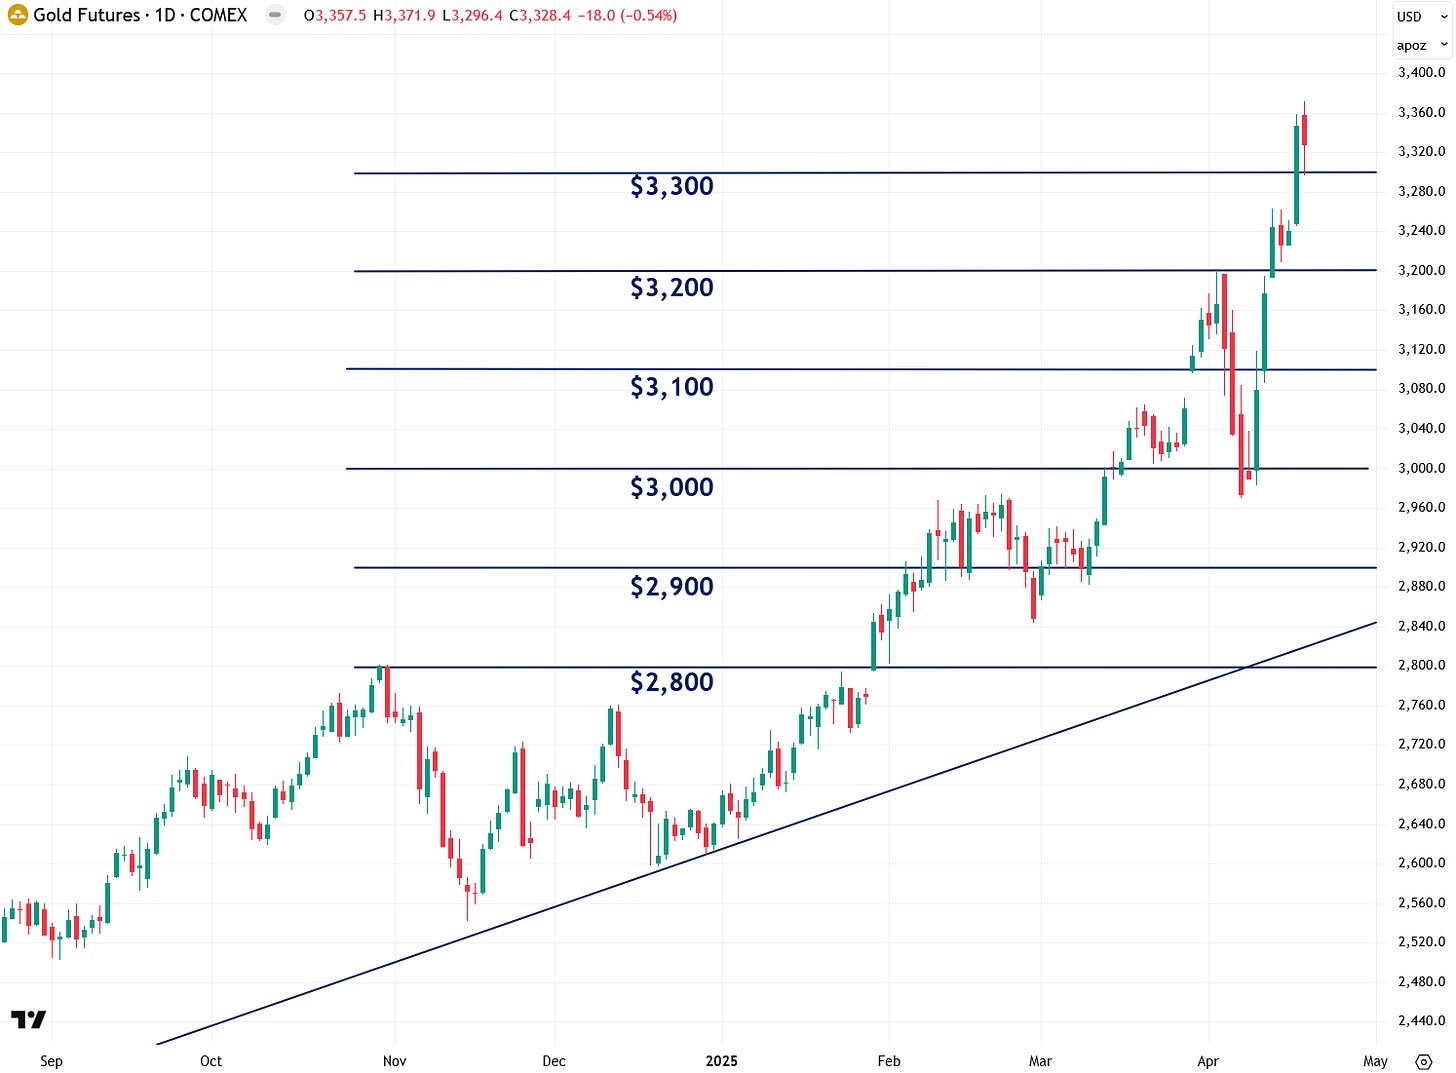
Let’s begin with COMEX gold futures, which I find more insightful for analysis than the spot price—mainly because $100 increments in COMEX gold often act as key psychological support and resistance levels. During the sharp tariff-driven pullback from April 7th to 9th, gold tested the critical $3,000 support level but held firm, just as I anticipated.
Since then, it has launched a powerful rebound, breaking decisively through the $3,100, $3,200, and now $3,300 resistance levels. Gold is officially in blue sky territory. This kind of breakout is exactly what investors dream of—and as precious metals investors, we’re living it right now. So enjoy the moment!
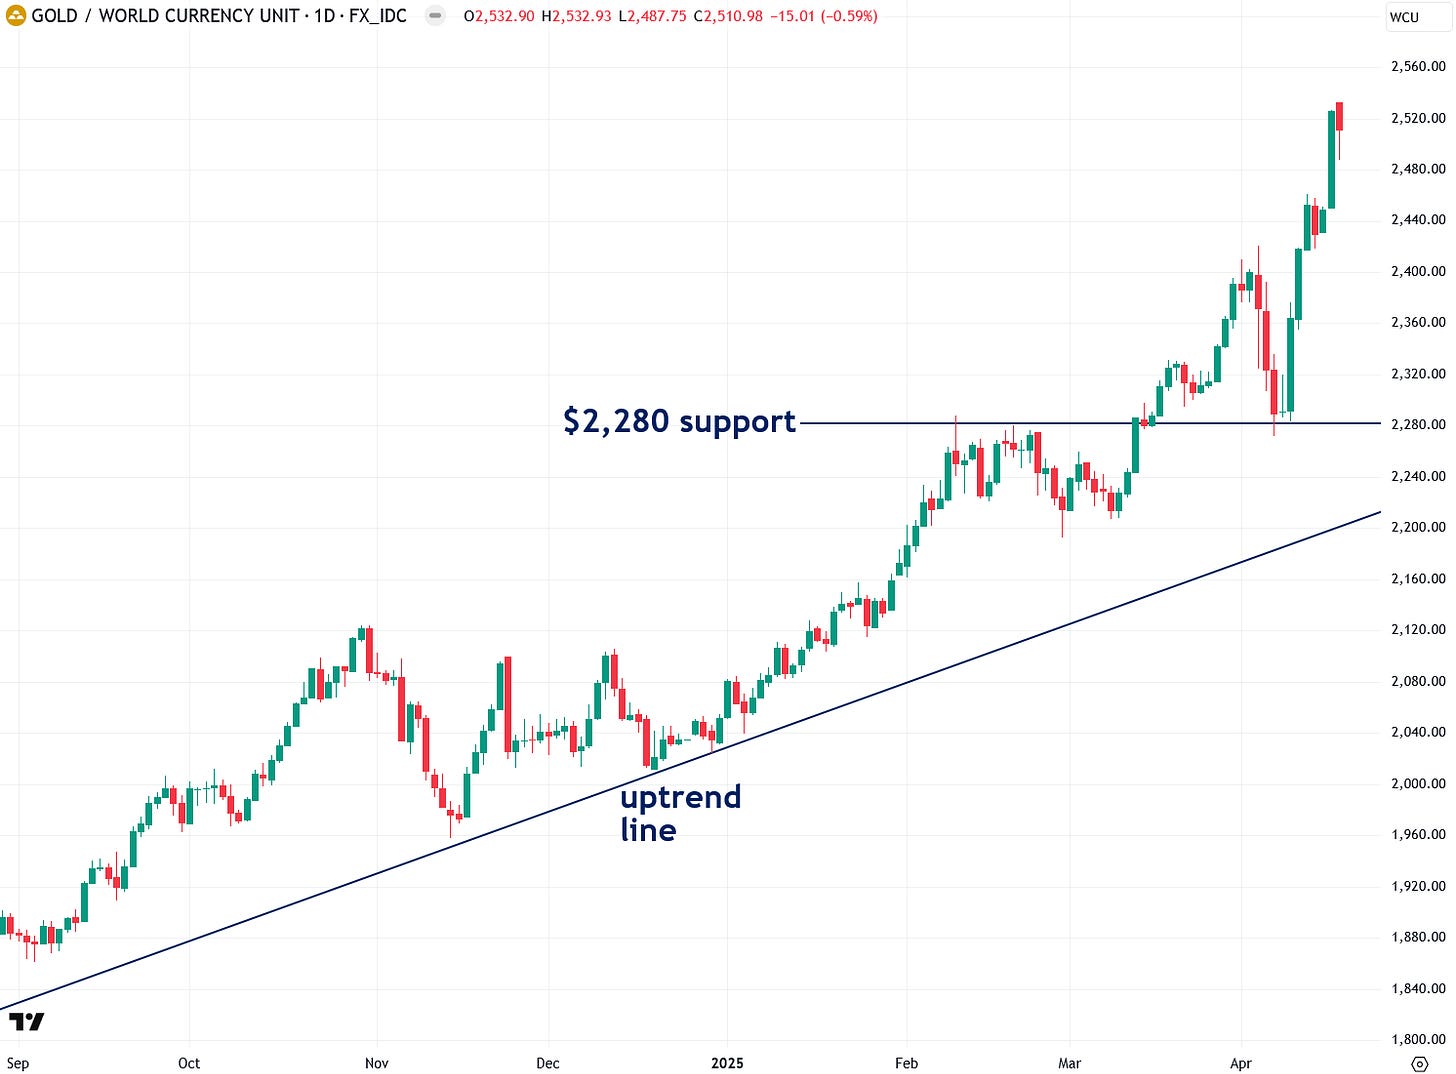
I’m now closely watching gold priced in the World Currency Unit (WCU)—a global composite currency derived from the top 20 world economies, weighted by GDP. I find this approach especially valuable because it prevents any single currency, whether the U.S. dollar, euro, or others, from having an outsized influence on gold’s price. In many ways, gold priced in WCUs offers the fairest and most accurate representation of how gold is truly performing on a global basis.
The chart of gold priced in WCUs shows a clear uptrend over the past year. A key level formed around 2,280, which acted as resistance in February and early March. Gold’s breakout above that level was a bullish signal. Then, during the tariff panic earlier this month, gold pulled back and successfully retested 2,280—now acting as support—before rebounding sharply to new all-time highs. This chart looks excellent—there’s no two ways about it. With no resistance overhead, the bias remains firmly to the upside for now.
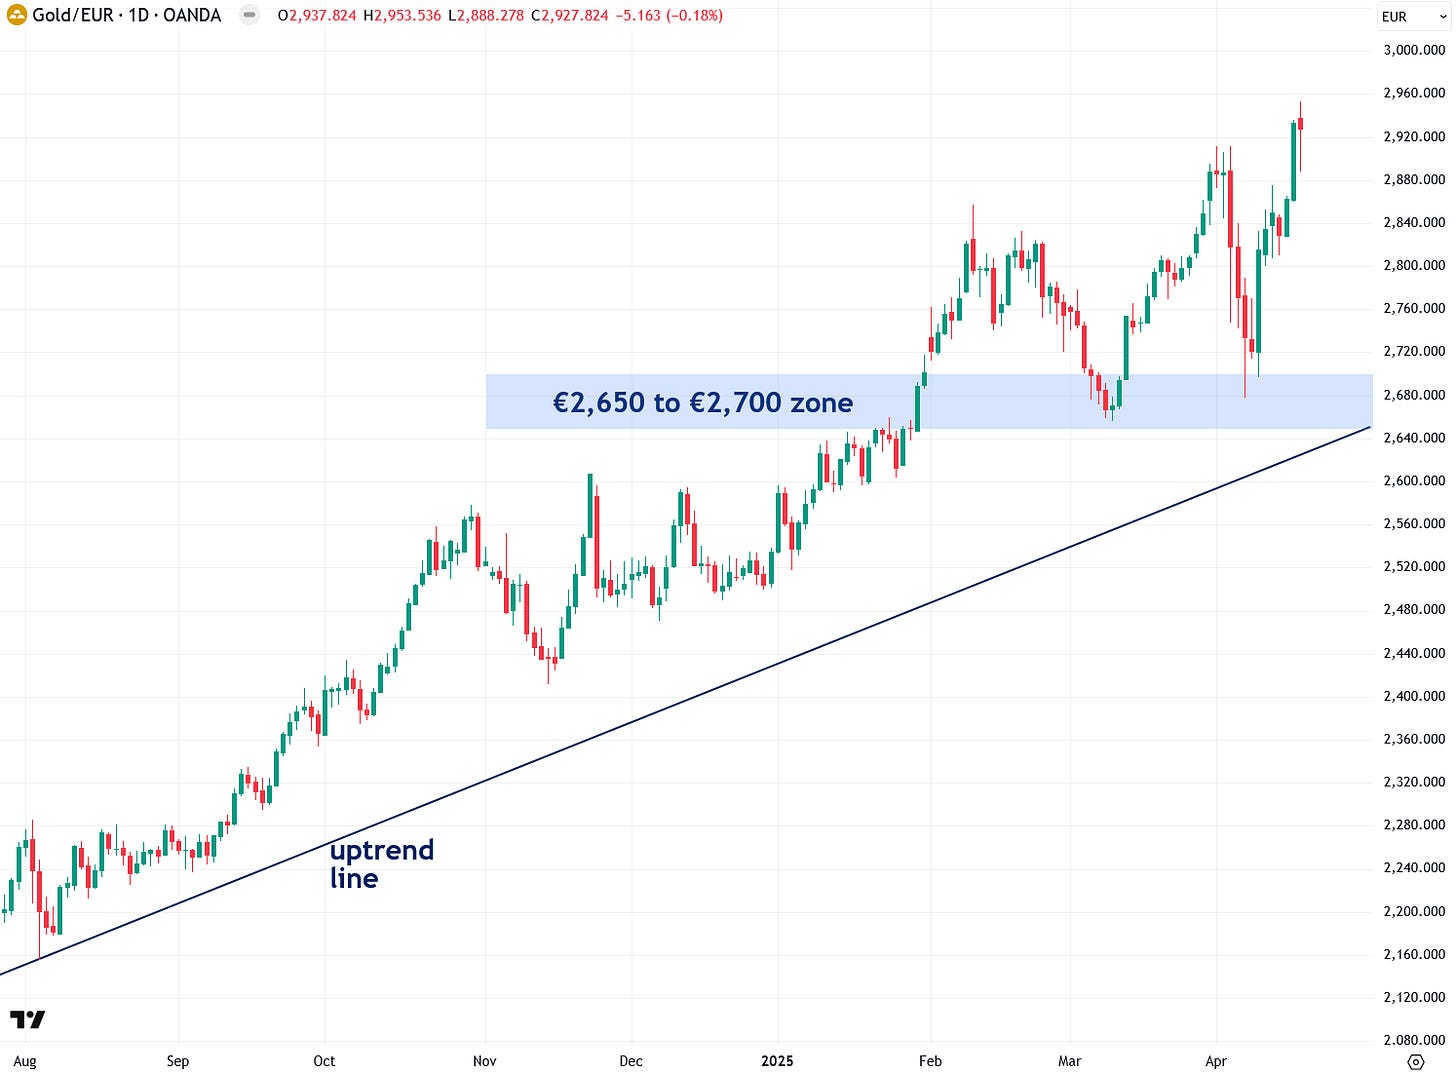
Gold priced in euros recently tested—and held—key support in the €2,650 to €2,700 zone I highlighted in my last update. Since then, it has surged to a new all-time high, a clear display of technical strength. This is not a chart I’d want to bet against.
I also closely track gold priced in euros, British pounds, and Swiss francs, as this unique currency blend offers a clearer lens into gold’s intrinsic strength. Support and resistance levels tend to form cleanly in this mix, making it a valuable gauge. During gold’s pullback earlier this month, it dipped into the key 7,200–7,400 support zone and bounced sharply—quickly rallying to new all-time highs. That’s a clear and compelling bullish signal.
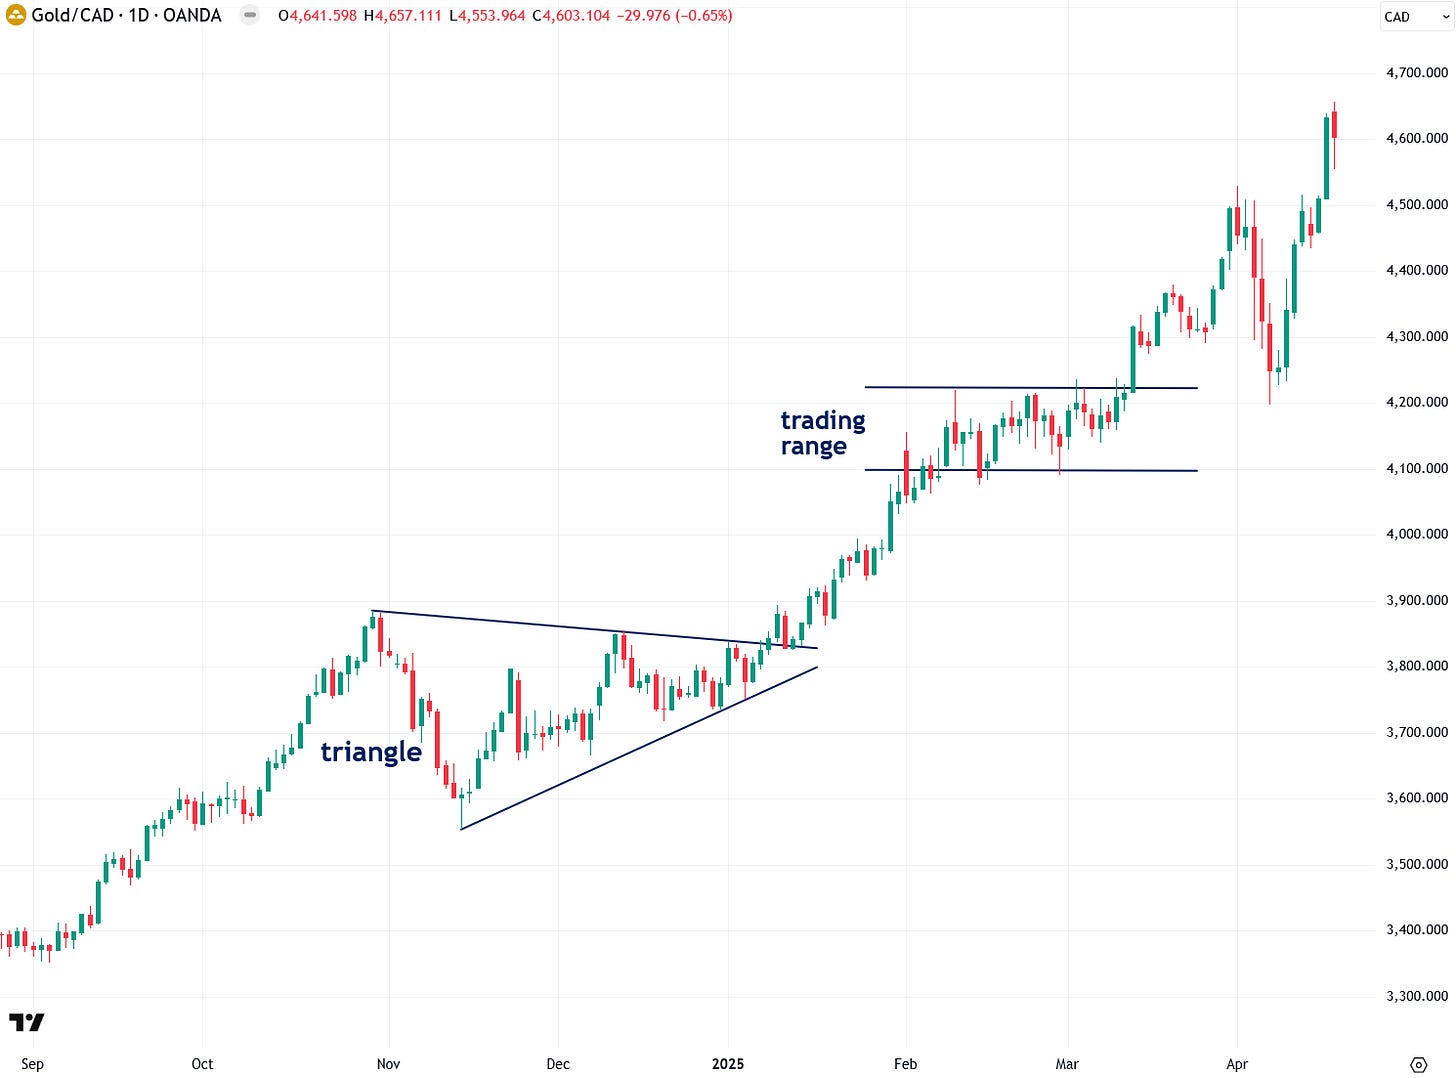
I pay close attention to gold priced in Canadian dollars, as Canada is a major force in the global gold industry. It ranked fourth worldwide in 2023, producing 200 metric tons of gold, and is home to the Royal Canadian Mint—maker of the widely recognized Canadian Gold Maple Leaf coins, a favorite among investors globally.
Gold priced in Canadian dollars broke out of a triangle pattern in early January, followed by a breakout from a trading range in mid-March—both strong signals of a continuing bull market. During the brief pullback a couple of weeks ago, gold retested the top of that recent range, held it as support, and then surged to a new all-time high. This chart looks stellar to me.
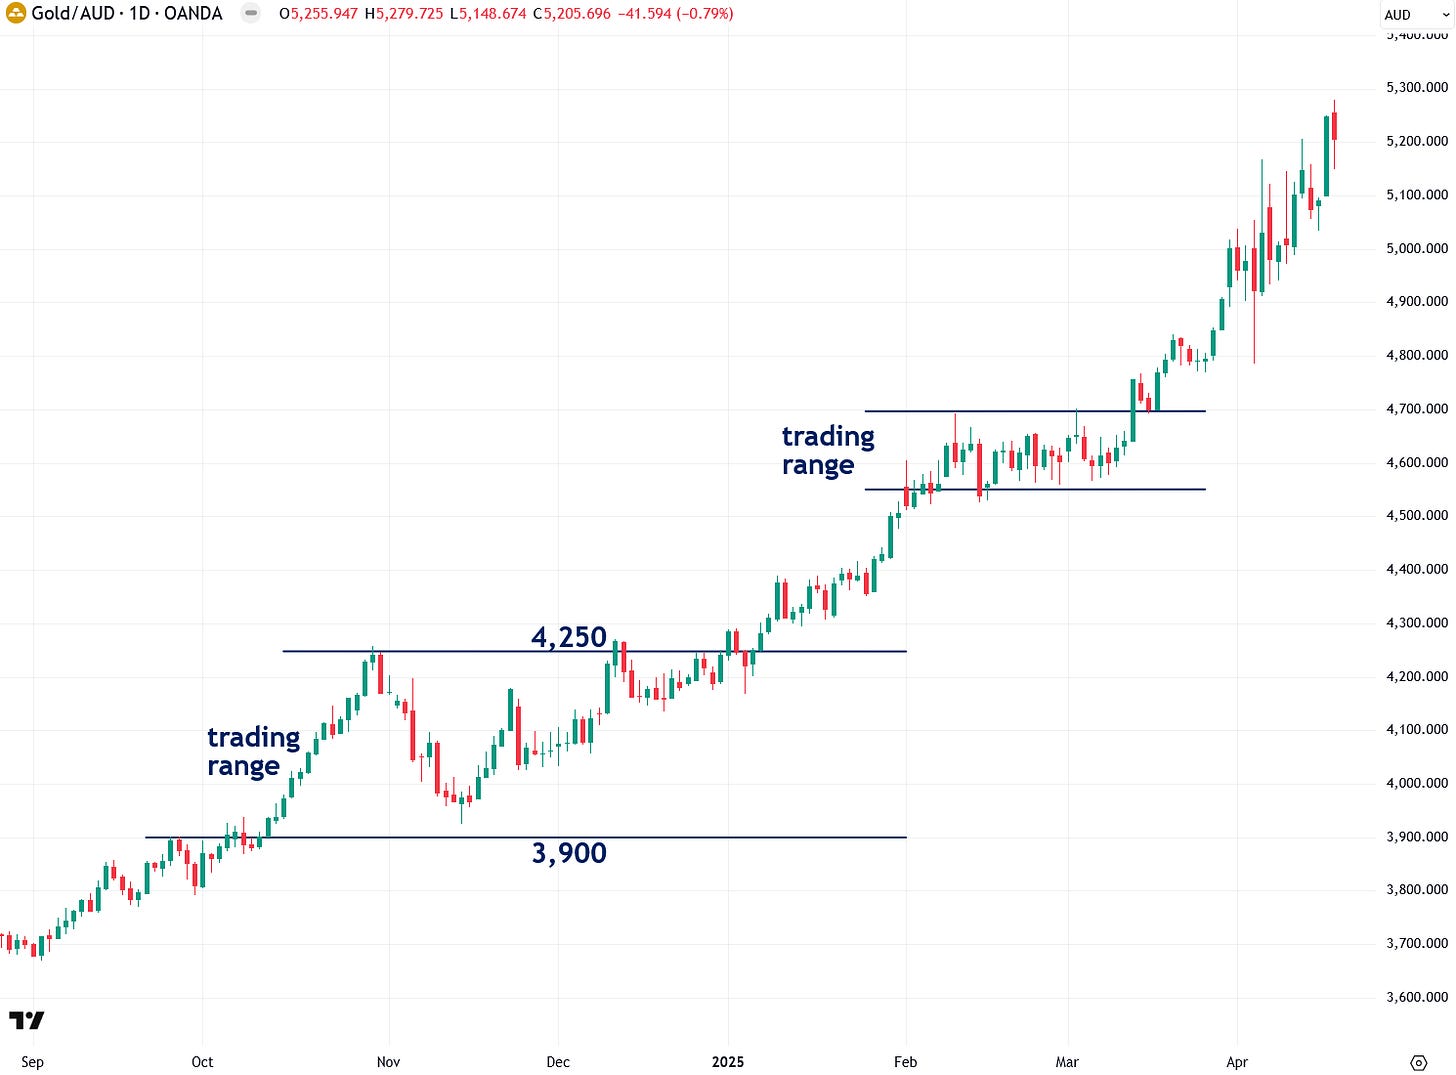
Gold priced in Australian dollars is also worth watching, given Australia’s key role in the global gold market. As the world’s second-largest gold producer—with 310 metric tons mined in 2023—and home to the Perth Mint, which produces the popular Kangaroo gold coins and a widely traded line of gold bars, Australia is a major player in the gold arena.
Gold priced in Australian dollars broke out of two major trading ranges in January and again in March—both strong bullish technical signals. Notably, during the market correction a couple of weeks ago, gold in AUD barely pulled back, a clear sign of underlying strength. Right now, this chart looks beautiful—exactly the kind of setup that trend-following traders and investors like myself aim to be positioned in.
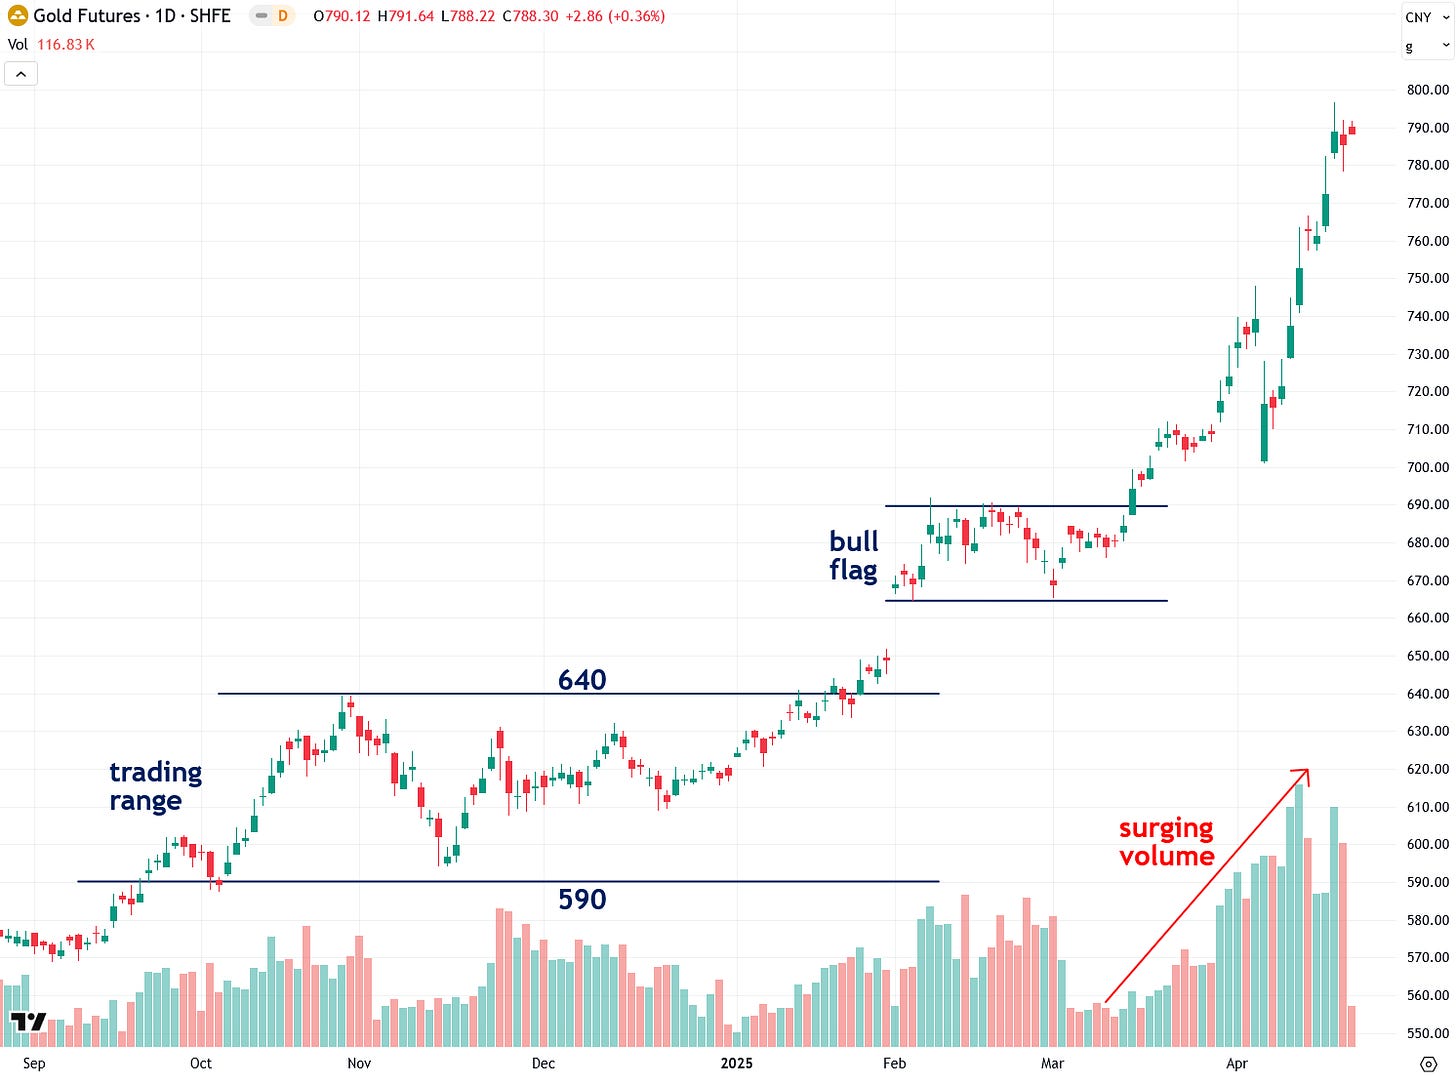
China has rapidly emerged as one of the dominant forces in the global gold market—ranking among the top producers with 370 metric tons mined in 2023, as well as one of the largest consumers. Today, it’s also one of the most influential drivers of gold’s price direction.
China’s gold benchmark—the Shanghai Futures Exchange (SHFE) gold futures—broke out of a trading range in late January, followed by a bull flag breakout in mid-March. At the time, I noted this setup would likely draw aggressive Chinese futures traders back into the market and propel gold beyond $3,000—and that’s exactly how it’s played out, as confirmed by Bloomberg just a few days ago.
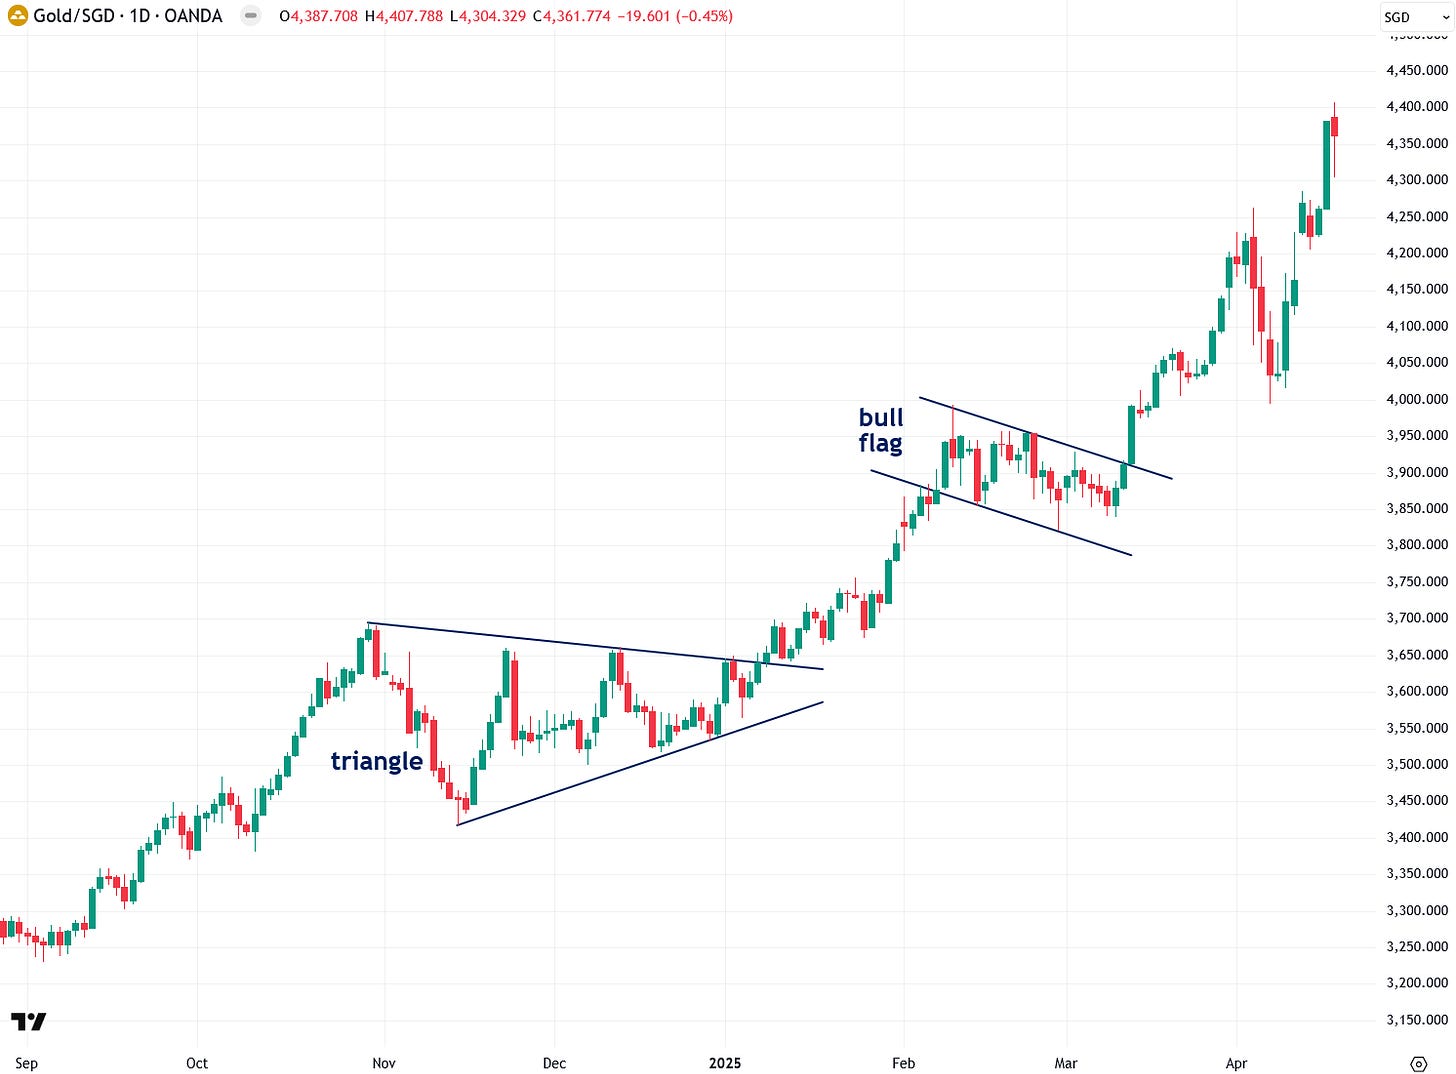
Gold priced in Singapore dollars broke out of a triangle pattern in January, followed by a recent breakout from a bull flag pattern—both clear bullish signals. This chart is particularly noteworthy, as Singapore is a key regional gold trading hub with growing influence in the global gold market. Its strategic position and expanding role in the gold industry make gold priced in Singapore dollars an important indicator to watch.
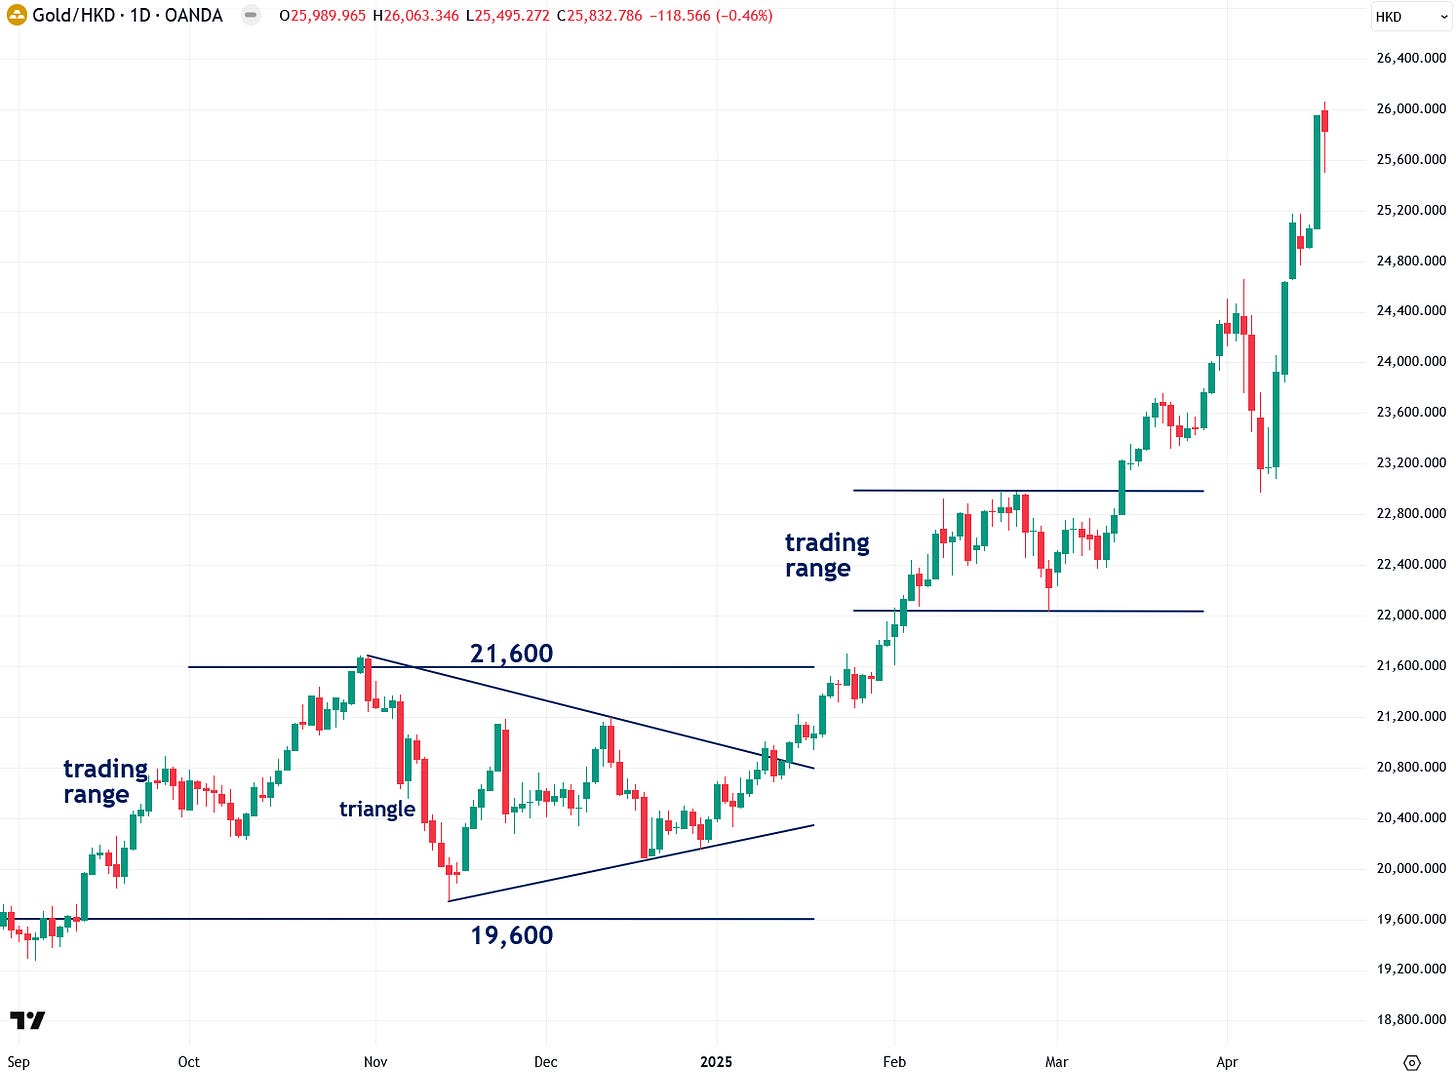
Gold priced in Hong Kong dollars broke out of a triangle pattern in January, followed by another breakout from a trading range in mid-March—two strong bullish signals that reinforce the strength of the current uptrend. Like Singapore, Hong Kong serves as a major global banking and gold trading hub, making this chart worth monitoring.
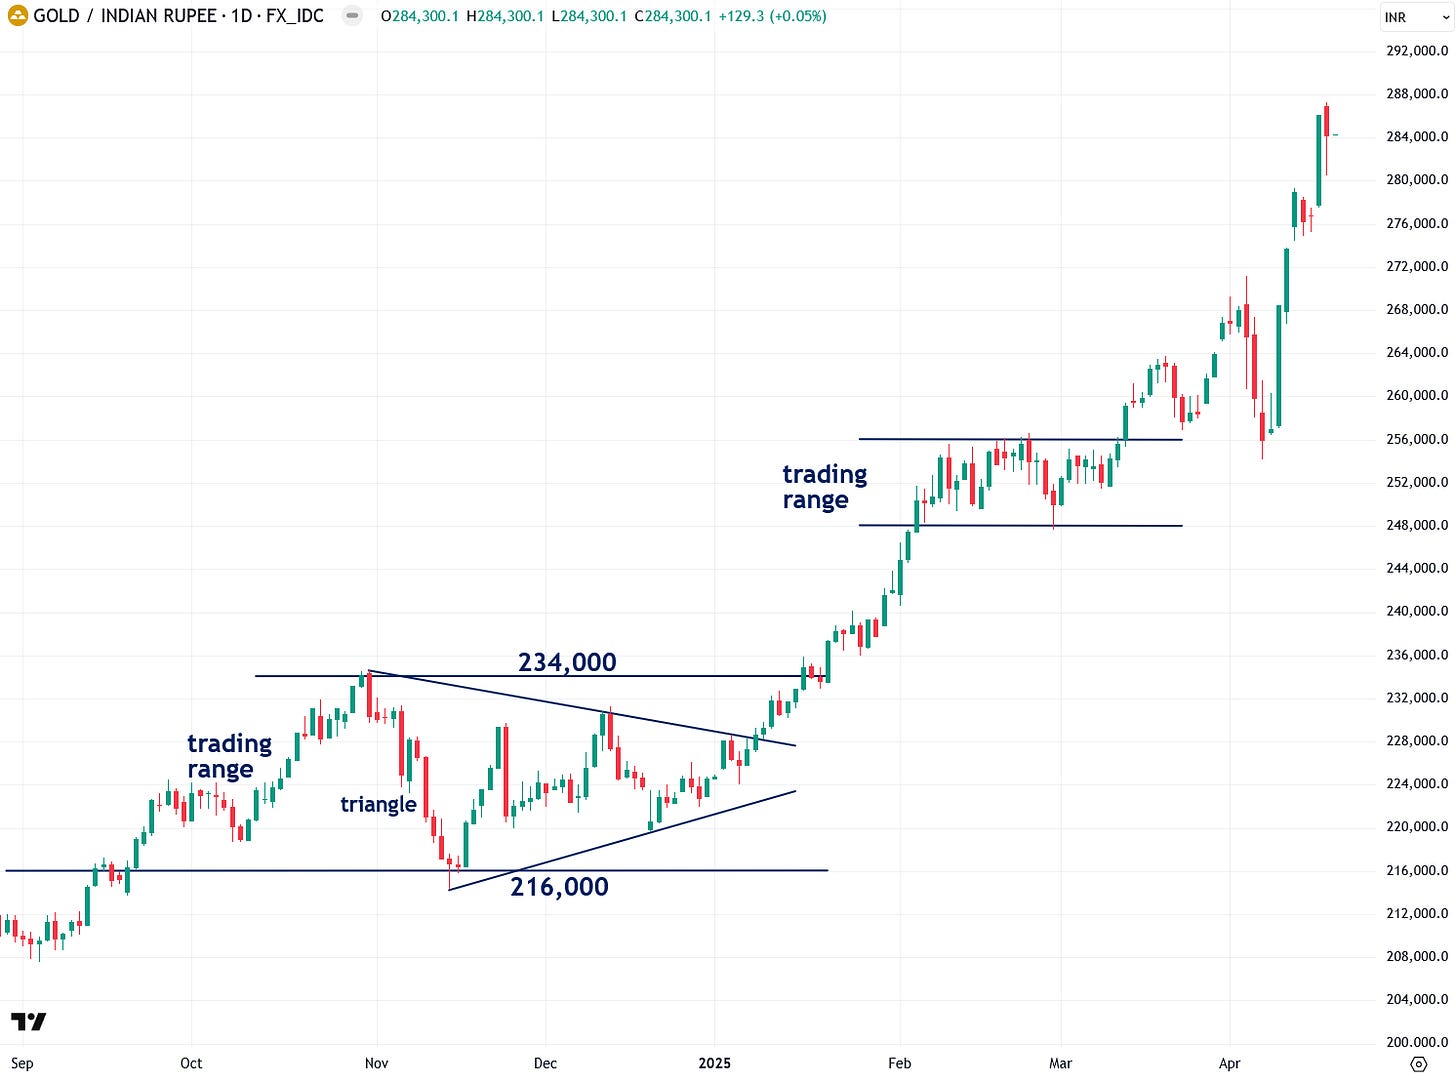
Gold priced in Indian rupees is a key chart to watch, as India—like China—is one of the world’s largest gold consumers. In January, it broke out of a triangle pattern, followed by a breakout from another trading range in mid-March—both clear and powerful bullish signals.
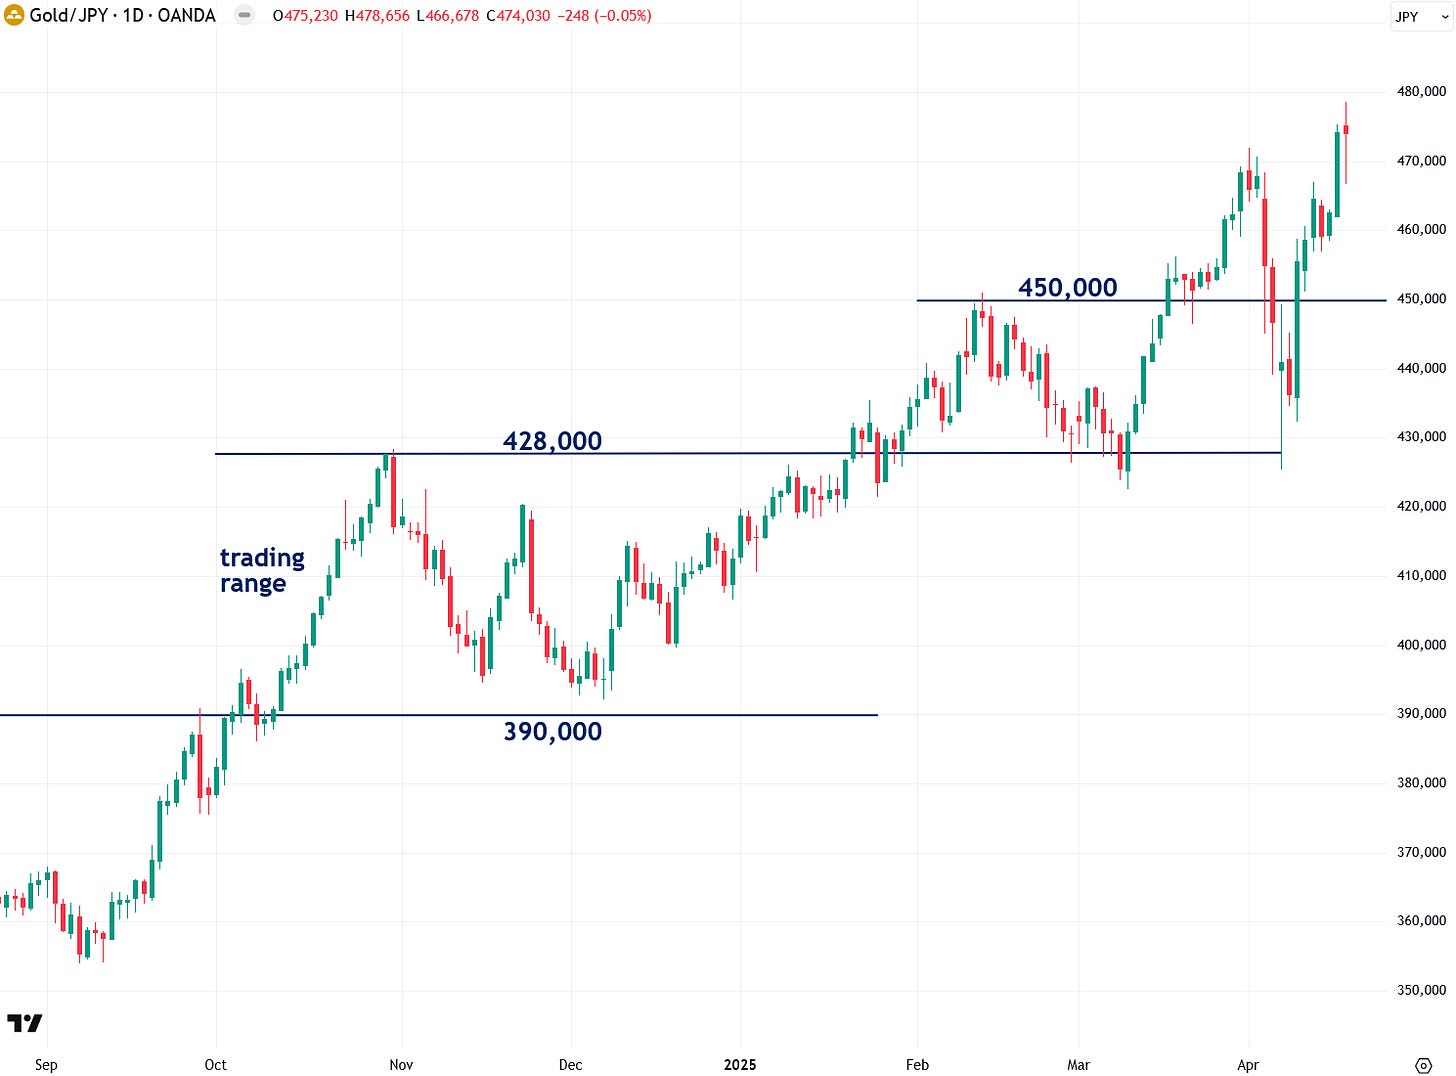
Gold priced in Japanese yen broke out of its 390,000–428,000 range in January, then rallied further with a second breakout above the 428,000–450,000 zone, ultimately reaching a new all-time high—a clearly bullish development.
Next, let’s turn to the gold mining sector, starting with the large-cap VanEck Gold Miners ETF (GDX). As I’ve noted in recent updates, GDX recently broke out of a long-term triangle pattern that stretches all the way back to 2011—a major bullish development. However, I also pointed out that a decisive breakout above the key $42–$46 horizontal resistance zone would be needed to fully confirm the move.
That breakout has now occurred over the past couple of weeks, marking an extremely bullish signal that has me particularly excited. That’s why I’m launching a new series of in-depth reports detailing my bullish thesis on the gold and silver mining sector—beginning with the first installment, which lays out the long-term bullish case for gold itself. If you haven’t already, I strongly recommend reading it so you’re fully up to speed and ready for what’s coming next.
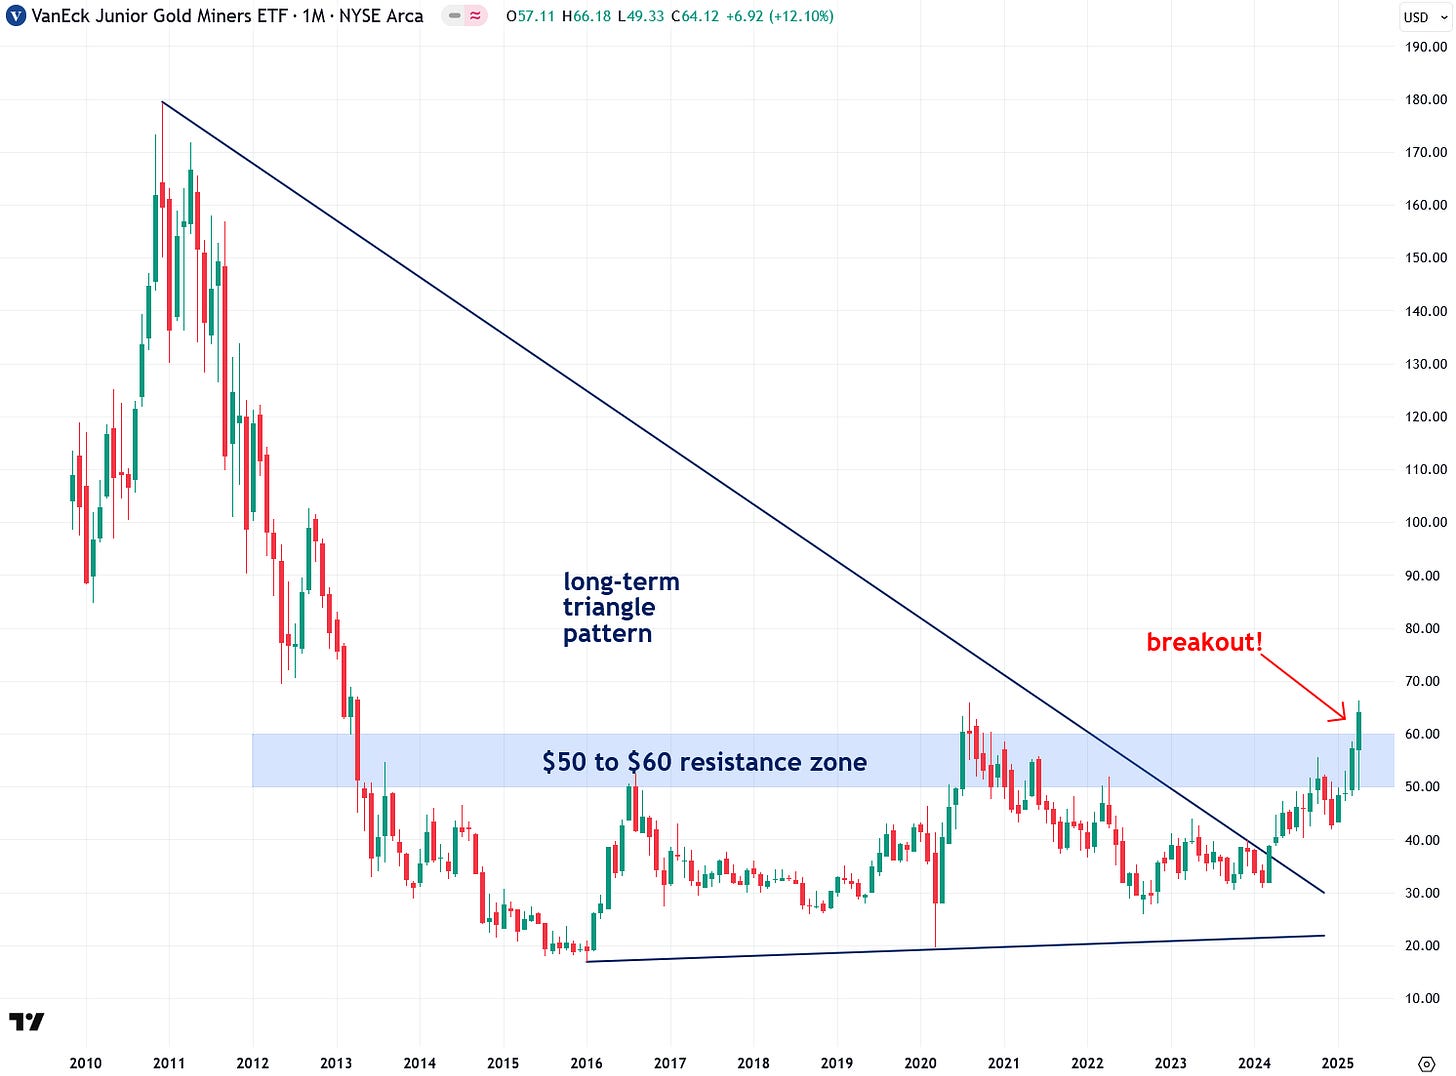
Similarly, the VanEck Junior Gold Miners ETF (GDXJ) broke out of a long-term triangle pattern in early 2024—an early signal that a new bull market was underway. For full confirmation, I’ve been closely watching for a decisive close above the key $50–$60 resistance zone, which would validate the breakout and pave the way for significantly more upside. That breakout has finally occurred in recent weeks, solidifying the bullish trend.
As gold continues hitting one new high after another, there’s no shortage of chatter—especially from those who missed the explosive bull market over the past year—claiming that gold is too high, overbought, or risky at these levels.
I couldn’t disagree more. The trend is undeniably up, and there are no signs of weakness in sight. This is precisely when the classic trading wisdom applies: “trade with the trend,” “the trend is your friend,” and “cut your losses, let your winners run.”
And as someone sitting on a winning trade, I’m letting it ride for maximum upside. Even at just over $3,300 an ounce, gold remains dramatically undervalued compared to my long-term target of $15,000+, as I laid out in detail in my recent must-read report on the bullish case for gold.
For those still wondering when the best time to sell gold is, I’ll leave you with one of my favorite quotes from Swiss banker and precious metals expert Egon von Greyerz:
“You should only sell gold when governments start running surpluses, stop printing money, and reduce debt — all of which is highly unlikely.”
Written by Jesse Colombo for The Bubble Bubble Report.