Copper broke out to a new all-time high yesterday, signaling the start of a powerful bull market—one that’s likely to unfold as part of a broader, long-term commodities supercycle.
Of course, I’ve been bullish on copper for several months. My view was that copper would emerge from its late 2024 slump and begin a long-term bull market.
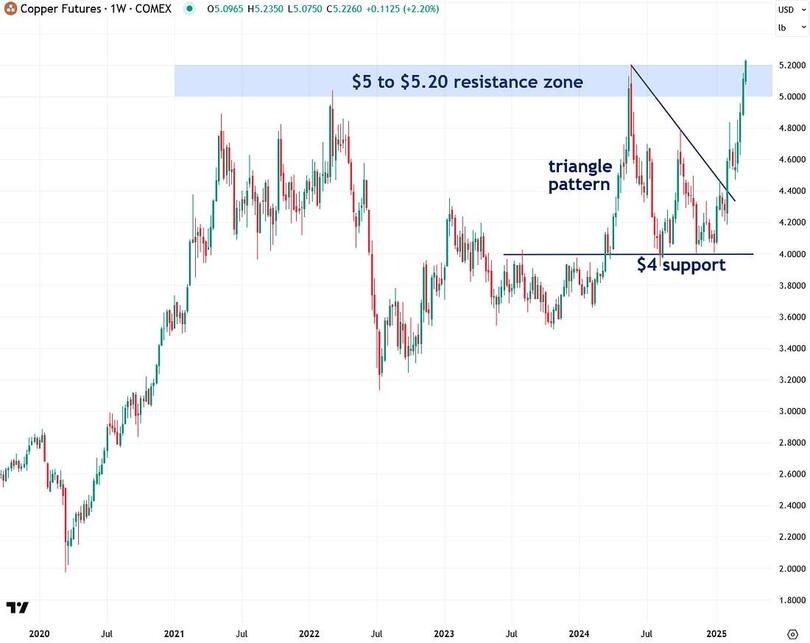
At the time of my initial call, copper was struggling to hold the $4.00 per pound level. Today, it has surged to a new all-time high of $5.21 — a breakout that signals the start of a powerful new bull cycle.
Given copper’s strong historical correlation with silver, and the role of arbitrage algorithms that reinforce this relationship, I believe silver is poised to follow copper’s lead higher.
Copper’s weekly chart reveals a major resistance zone between $5.00 and $5.20 — a level that has held firm for the past three years. Yesterday, copper began to push above this critical zone, which is a strong bullish signal.
However, for full confirmation of the breakout, I’d like to see a decisive weekly close at or above this level.
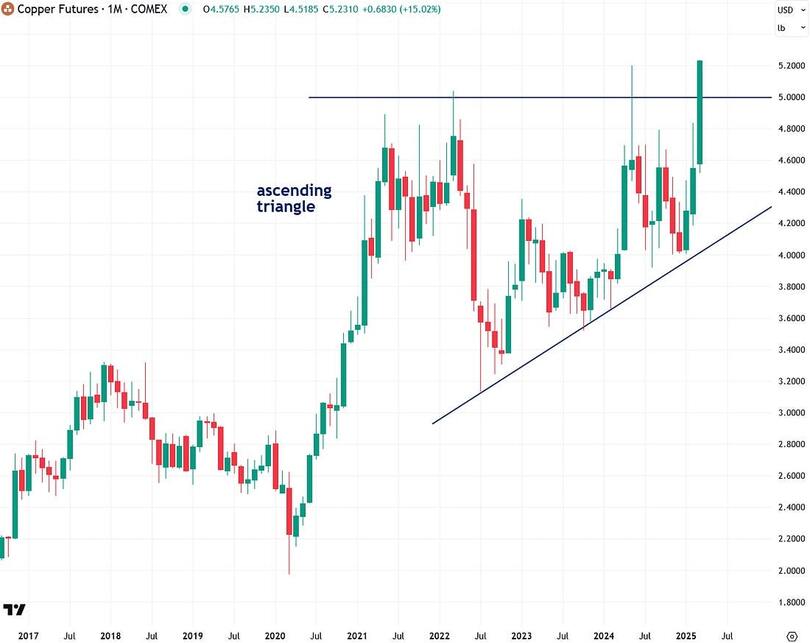
The monthly copper chart reveals an ascending triangle pattern that has taken shape over the past few years. Copper is now beginning to break out of this formation, which is a highly bullish development.
That said, I’d prefer to see the monthly candle close at or above this level to confirm the breakout. If confirmed, I believe this move will mirror the strength of the 2020 rally that preceded it.
Using the measured move principle in technical analysis, the breakout projects a potential $3 per pound advance—taking copper to $8, which represents a 53% gain from current levels.
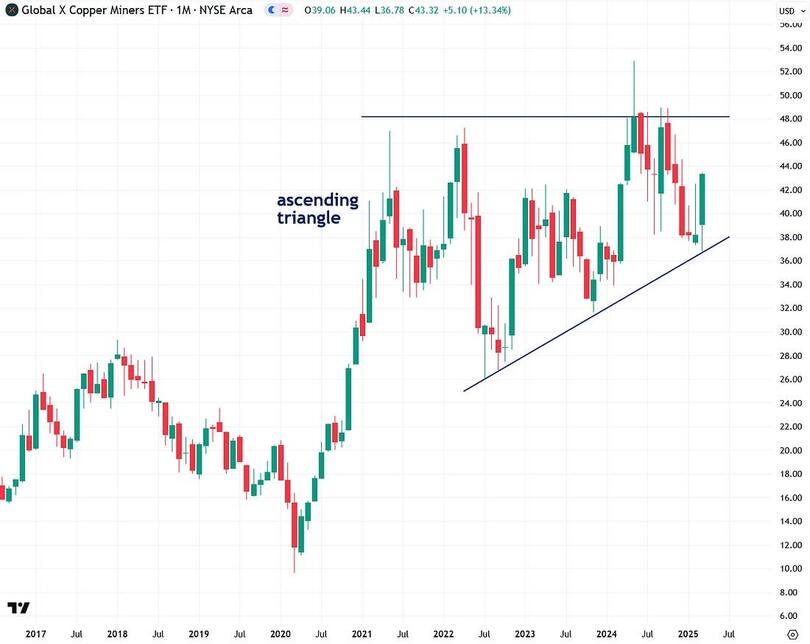
The Global X Copper Miners ETF (COPX) is also forming an ascending triangle pattern, though it has yet to break out. However, with copper’s bull market gaining momentum, a breakout in COPX appears likely in the near future.
The breakout in copper miners should also invigorate silver mining stocks (and the SIL and SILJ ETFs) given the significant overlap between the two as silver is often a byproduct of copper mining.
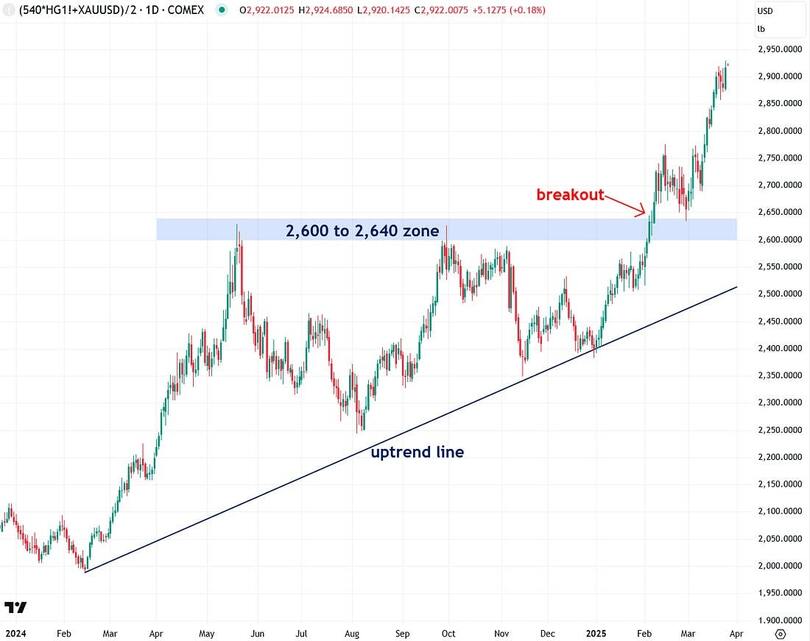
As I’ve often highlighted, I developed an indicator called the Synthetic Silver Price Index (SSPI) to validate and analyze silver’s price trends. The SSPI averages the prices of gold and copper, with copper weighted by a factor of 540 to ensure gold doesn’t dominate the calculation.
Although silver itself isn’t part of the input, the index has shown a strong correlation with silver’s actual price movements, offering valuable insights into its underlying price dynamics.
For much of the past year, the 2,600 to 2,640 zone has acted as a critical resistance for the SSPI. I’ve consistently stated that a breakout above this zone would mark the beginning of a bull market in both the SSPI and silver.
Now, with copper’s bull market gaining traction, the SSPI is set to move even higher—making it increasingly untenable for silver to remain stagnant. The ongoing divergence between silver and the SSPI is highly unusual.
However, that disconnect appears unsustainable. With upward pressure building, silver looks primed to break out—and that shift could happen at any moment.
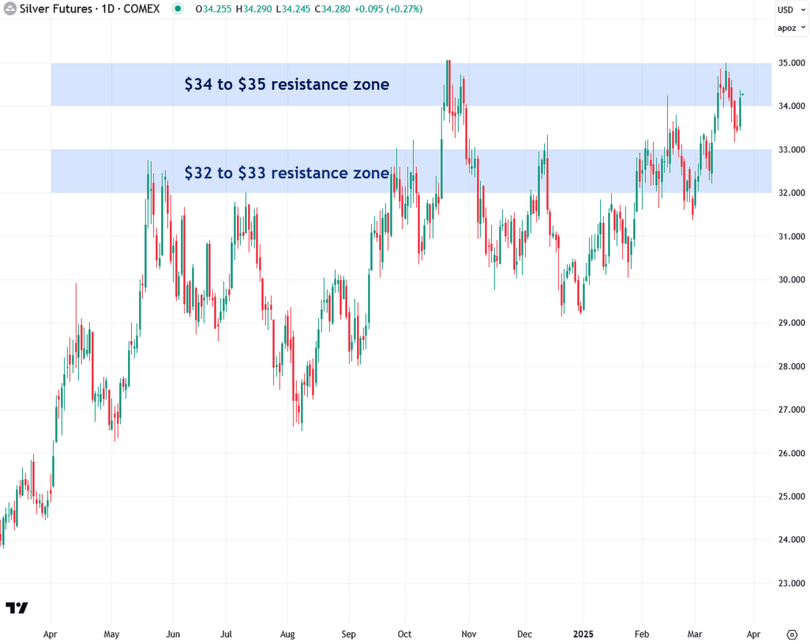
Now, let’s take a closer look at silver itself. COMEX silver futures saw a brief pullback over the past few days but rebounded sharply today with a 2.2% gain—right in line with my expectations, likely boosted by the strength in copper.
Importantly, silver continues to hold above the key $32–$33 support zone, which is an encouraging sign of underlying strength. The next critical test is the $34–$35 resistance zone.
Once silver breaks through this level decisively, I expect it to accelerate toward $40, $50, $60, and beyond.
In recent months, I’ve become increasingly convinced that we’re on the verge of a new commodities supercycle—one that could last 10 to 15 years, much like the boom of the 2000s.
This emerging cycle isn’t limited to gold, silver, or copper; it spans a wide range of commodities, from crude oil and natural gas to cotton, wheat, and sugar.
Copper’s recent breakout appears to align perfectly with this thesis, signaling the early stages of a broader, inflationary surge in hard assets.
Gold’s powerful $1,000-per-ounce rally over the past year may have been the market’s early warning—a sign that something big is brewing.
While this trend would have concerning implications, it also presents a tremendous opportunity for those who are aware of it.
I won’t delve into all the reasons behind my expectation of a commodities supercycle here (though I’ll explore them in depth in an upcoming report). For now, I’ll highlight a few key factors driving my view.
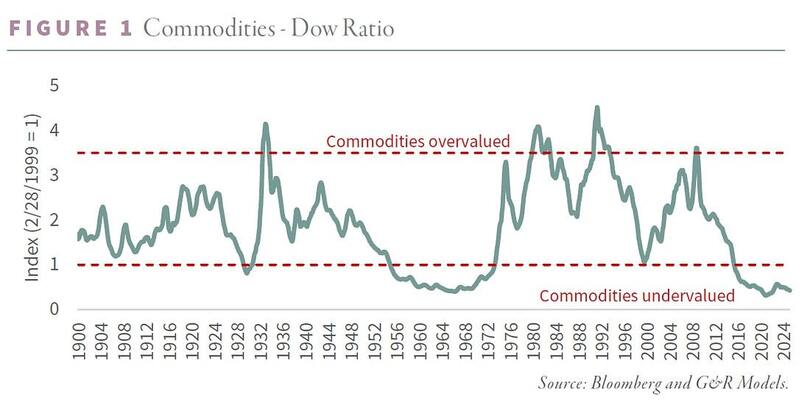
First, the commodities-to-Dow ratio shows that commodities are significantly undervalued compared to stocks, reaching levels historically seen before major commodity bull markets and periods of stock market stagnation.
This points to an impending capital rotation, where investment shifts from equities into hard assets and natural resources.
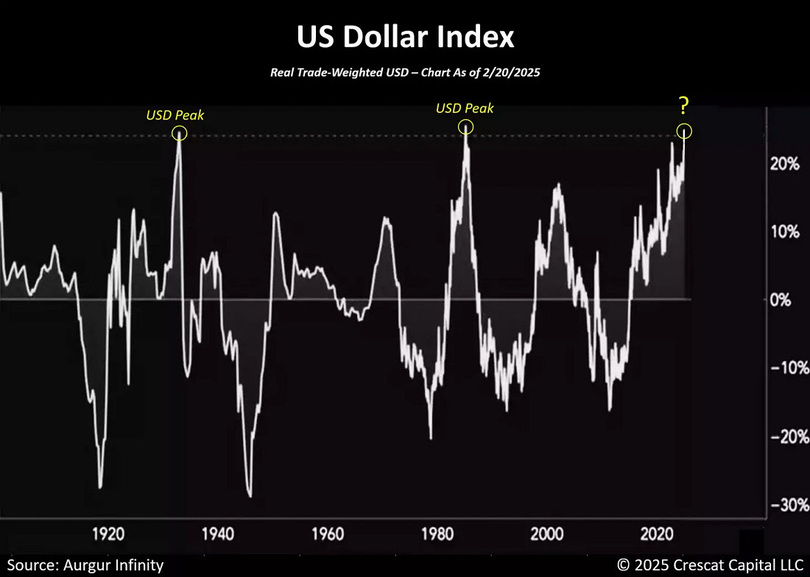
Another key reason I anticipate a commodities supercycle is the extreme overvaluation of the U.S. dollar relative to other fiat currencies, a phenomenon unseen in over 120 years of data except in 1933 and 1985—both periods followed by significant dollar declines.
Historically, the U.S. dollar and commodities share a strong inverse relationship. The dollar’s unusual strength in recent years has been a major factor suppressing commodity prices.
However, an impending correction in the dollar’s value should trigger a powerful bullish surge across the commodities sector, including assets like copper, gold, silver, and mining stocks.
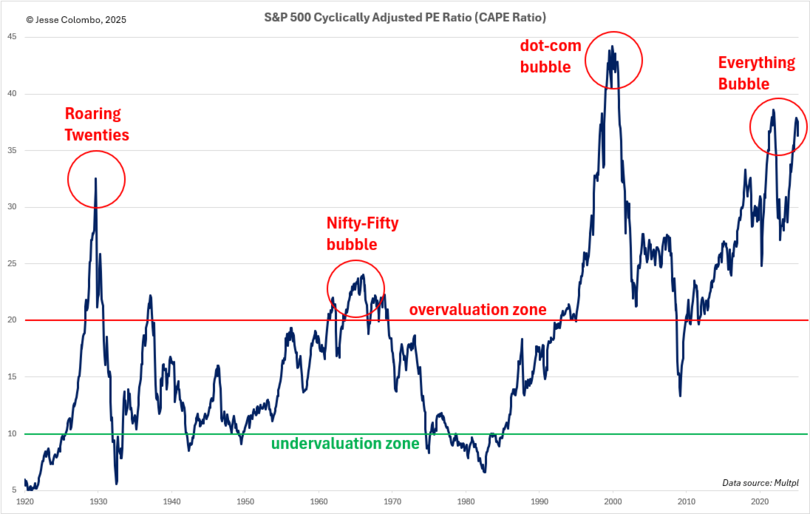
U.S. stocks are significantly overvalued and appear to be in a massive bubble.
One compelling indicator is the S&P 500’s cyclically adjusted PE (CAPE) ratio, which reveals a market more overstretched than it was before the 1929 crash and the Great Depression.
When this bubble bursts, much of that capital is going to shift into tangible, useful assets—namely commodities—driving their prices sharply higher. This surge will fuel severe inflation and further erode the value of fiat currencies.
To summarize, copper is embarking on a significant bull market, which I expect to be part of a broader commodities surge that will unfold in the late 2020s supercycle.
I expect the strength in copper and gold to propel silver out of its current lull, sparking a rally that takes most investors by surprise.
Meanwhile, I’m deeply concerned about the U.S. stock market bubble, which I believe is nearing its end. Its collapse will channel significant capital into hard assets, rewarding investors positioned in this space.
I’m aligning my strategy accordingly and look forward to sharing more insights on this theme in the future.
Shared by Golden State Mint on GoldenStateMint.com