Summary
- Despite gold’s recent surge, I now predict a pullback to $2,300 due to technical chart developments in related macro markets.
- The USD and bond yields are trading at key support levels, at a time when the market has aggressively priced in rate cuts.
- Cyclical commodity sectors like energy, base metals, and agriculture show potential for outperformance, suggesting disinflation fears may be overdone.

Gold may be surging higher after breaking out from a huge five-month base, but I think the probability of gold seeing a sustained pullback from these levels has increased dramatically.
I myself was a stout “bull-liever” of higher prices. I wrote back in August in “Precious Metals And Miners Primed For Next Leg Higher (Technical Analysis)” that gold prices were likely to ascend higher.
Then, gold was trading at $2,503. At the time of writing, gold is at $2,568, and had recently hit as high as $2,589.
While I wrote that my target for gold was $2,750-2,800, I am now changing course, and I am targeting a pullback to the $2,300 levels.
This opinion change is backed by recent developments on the technical charts of related macro markets, which I will elaborate more on below.
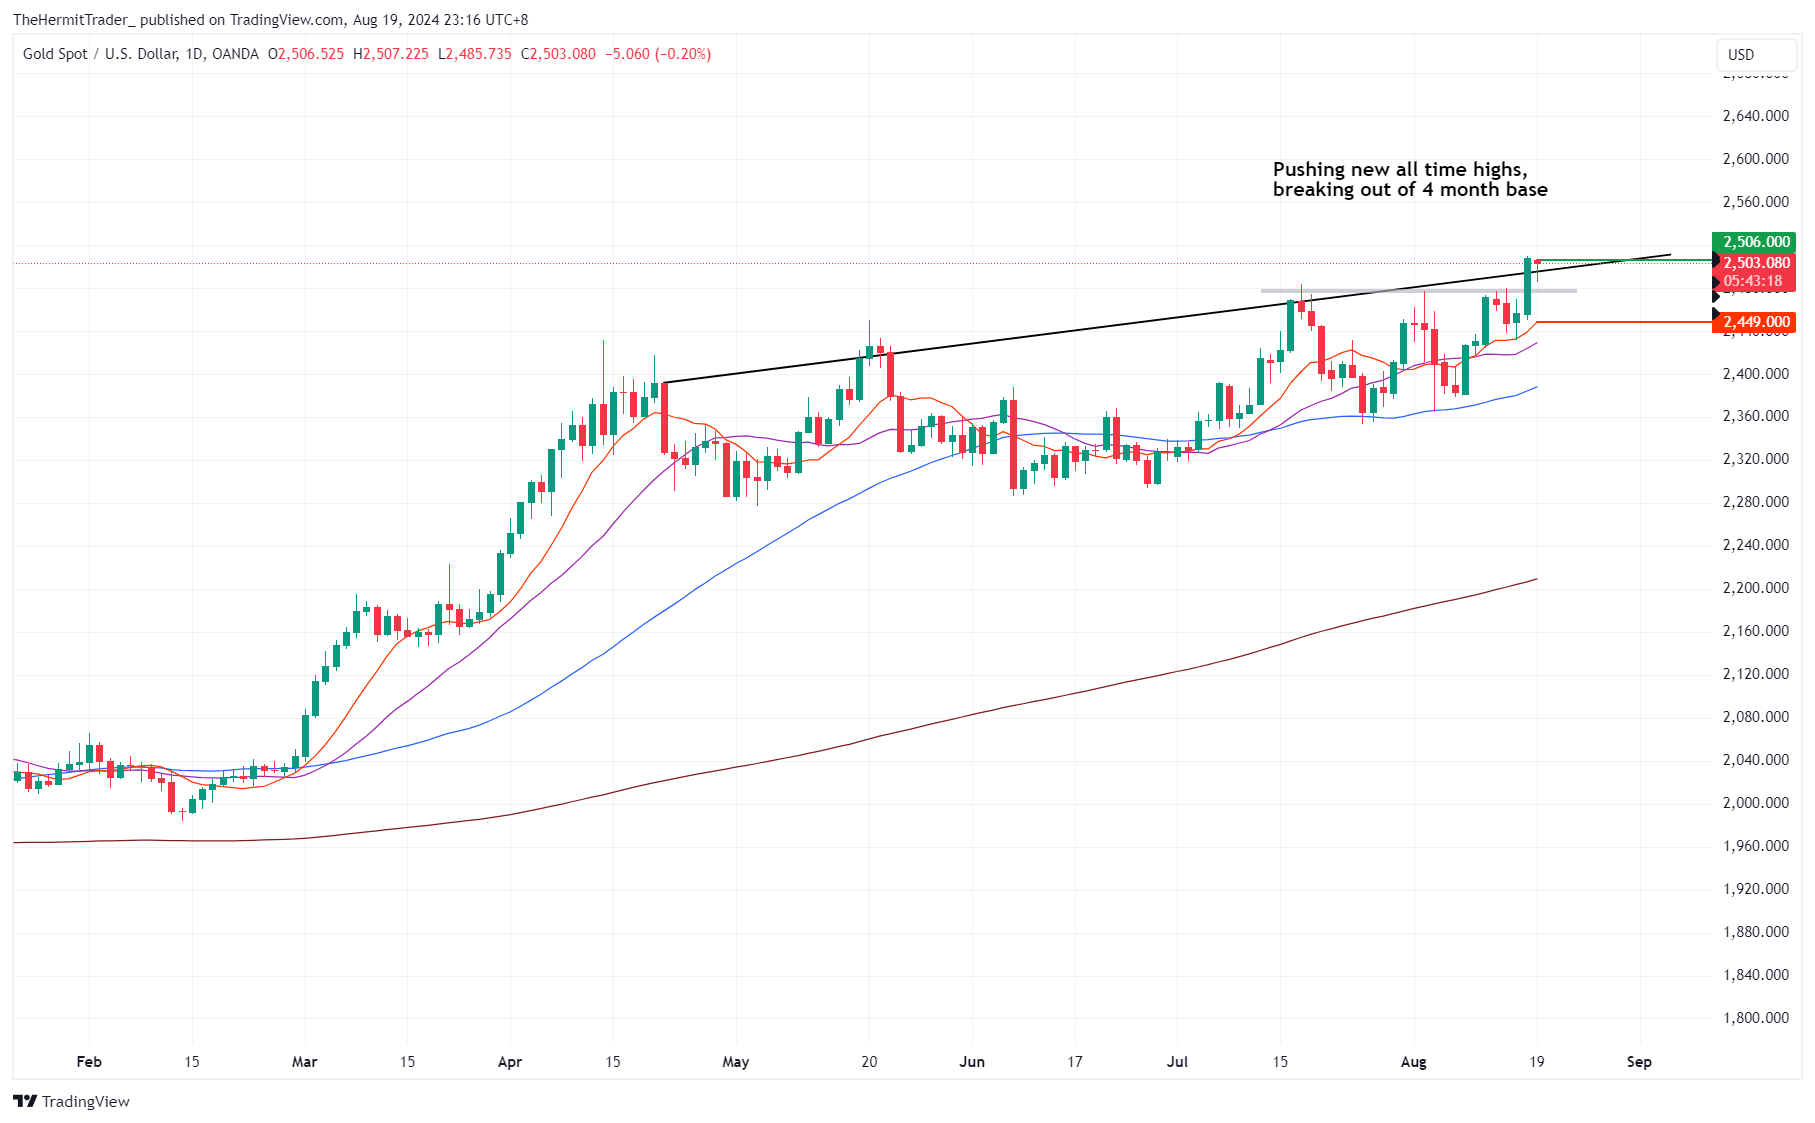
First, this was the technical chart of gold in my August article, where I was gunning for a breakout in gold prices from a large multi-month consolidative range.
Daily Chart: Gold (published 19 August)
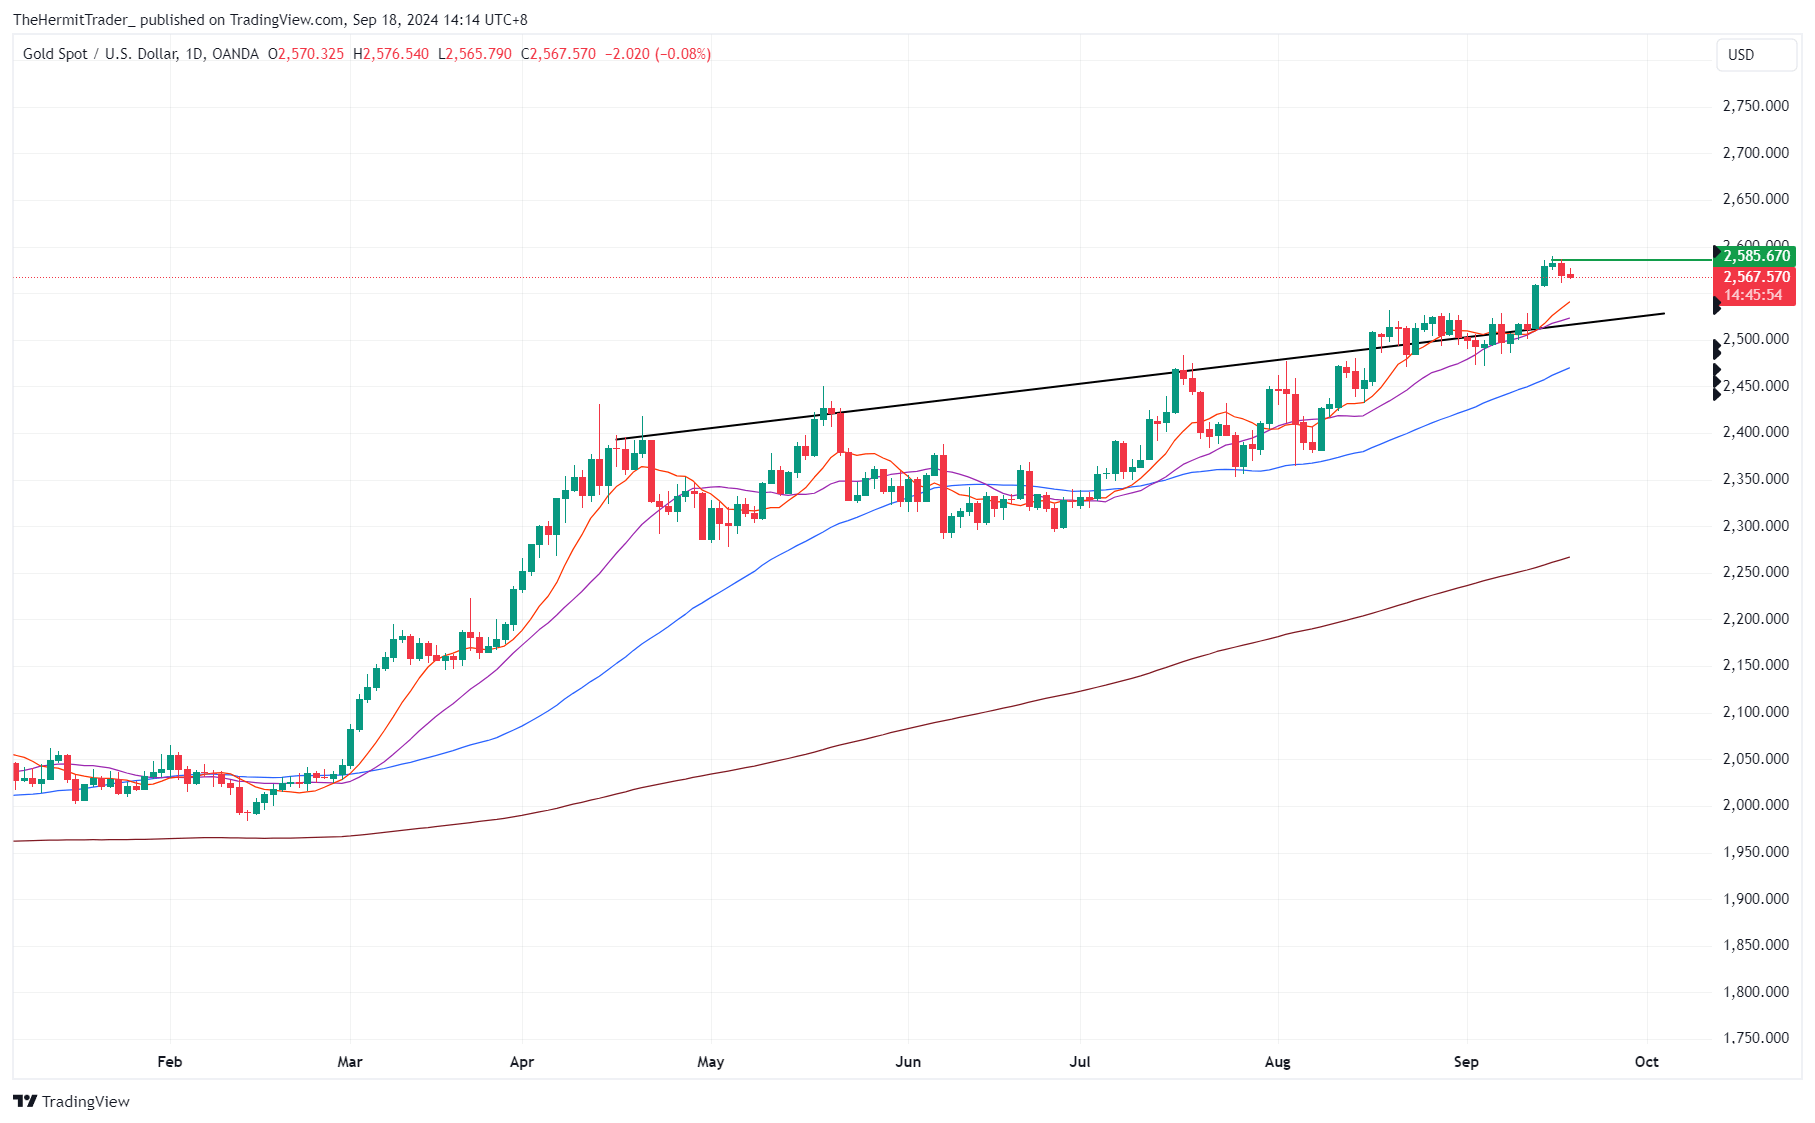
In the updated chart below, the breakout has since materialised.
Daily Chart: Gold (Updated)
Surely now, the path of least resistance is up, right?
Optically, that may look like the case, but let us do a deeper dive into related macro charts.
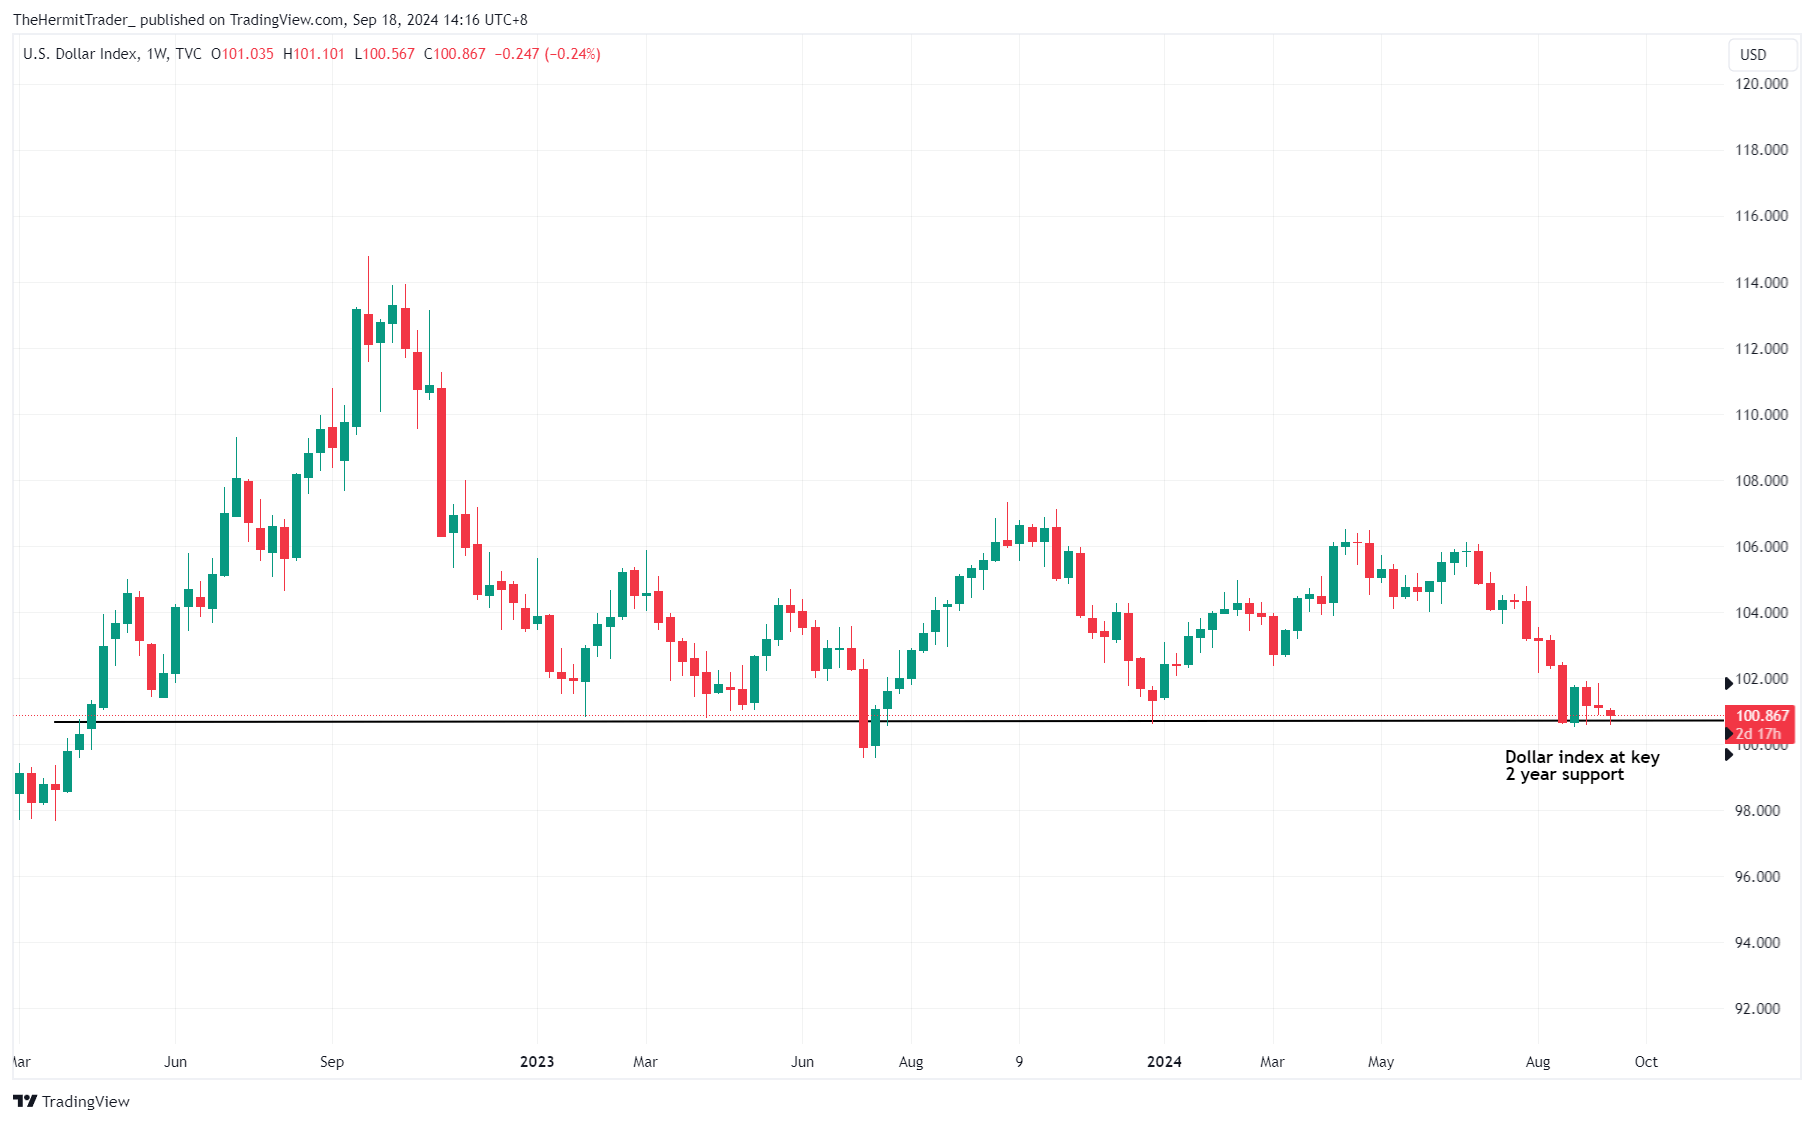
We cannot look at gold without looking at the USD. The dollar index is now trading right at key 2-year support, which is a very probable area to at least see a near term bounce at.
Weekly Chart: Dollar Index
Looking at USD positioning, while not bearish to an extreme degree, net dollar bets have dipped into negative territory for the first time since February.
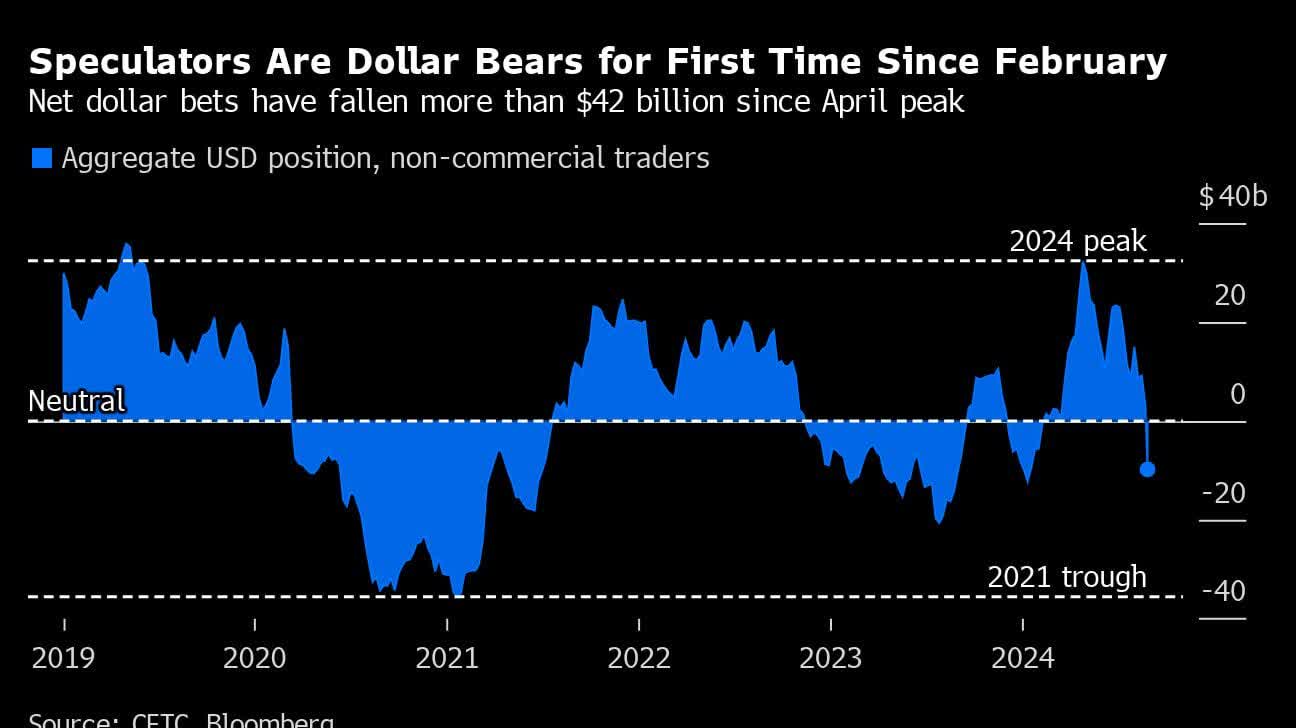
The market is getting increasingly net short USD on the back of rising expectations that the Fed will be forced to cut rates aggressively in the coming months due to disinflation.
This is evident from the Fed rate cut probabilities in the upcoming meetings.
For this week’s September meeting, the market is pricing zero chance of the Fed doing nothing. The market has priced in a 100% chance of a rate cut, out of which there are higher odds (61%) that interest rates will be cut by 50bps instead of 25bps.
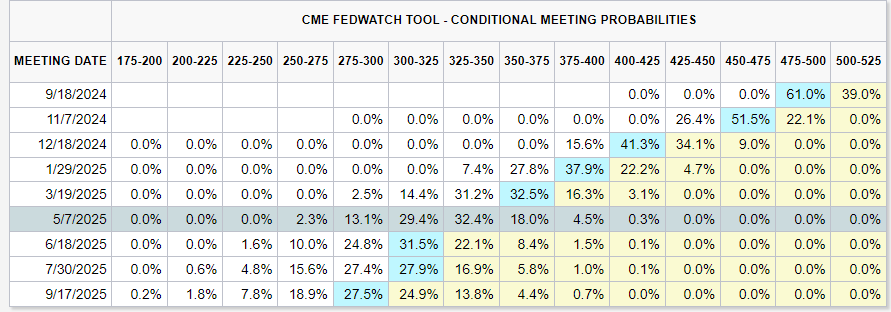
By the end of the year, the Fed is expected to cut rates by 125bps, over the course of 3 meetings!
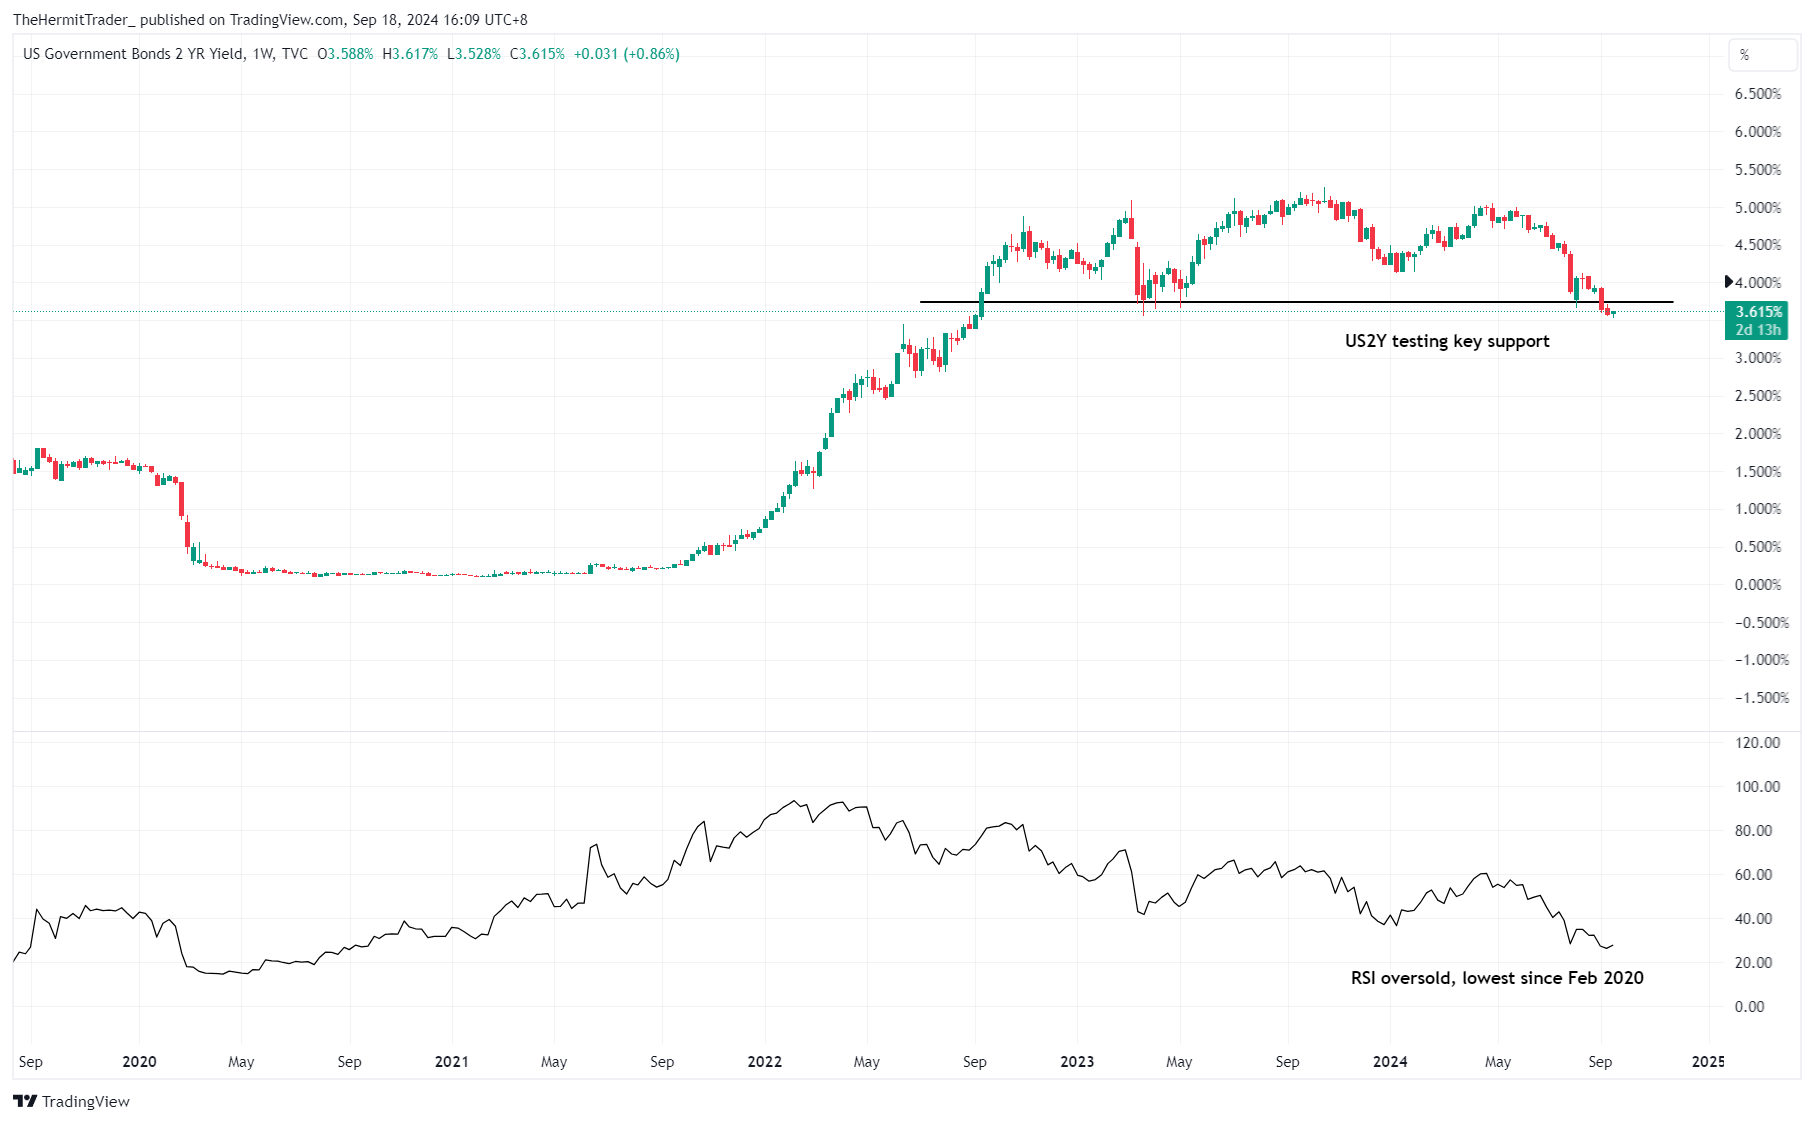
As such, the market is heavily leaning towards a very dovish Fed, at a time when the US2Y yield is testing key support on the weekly chart. Its weekly RSI (lower panel) is also at the most oversold since Feb 2020.
Weekly Chart: US2Y Yield
Are disinflation fears overblown?
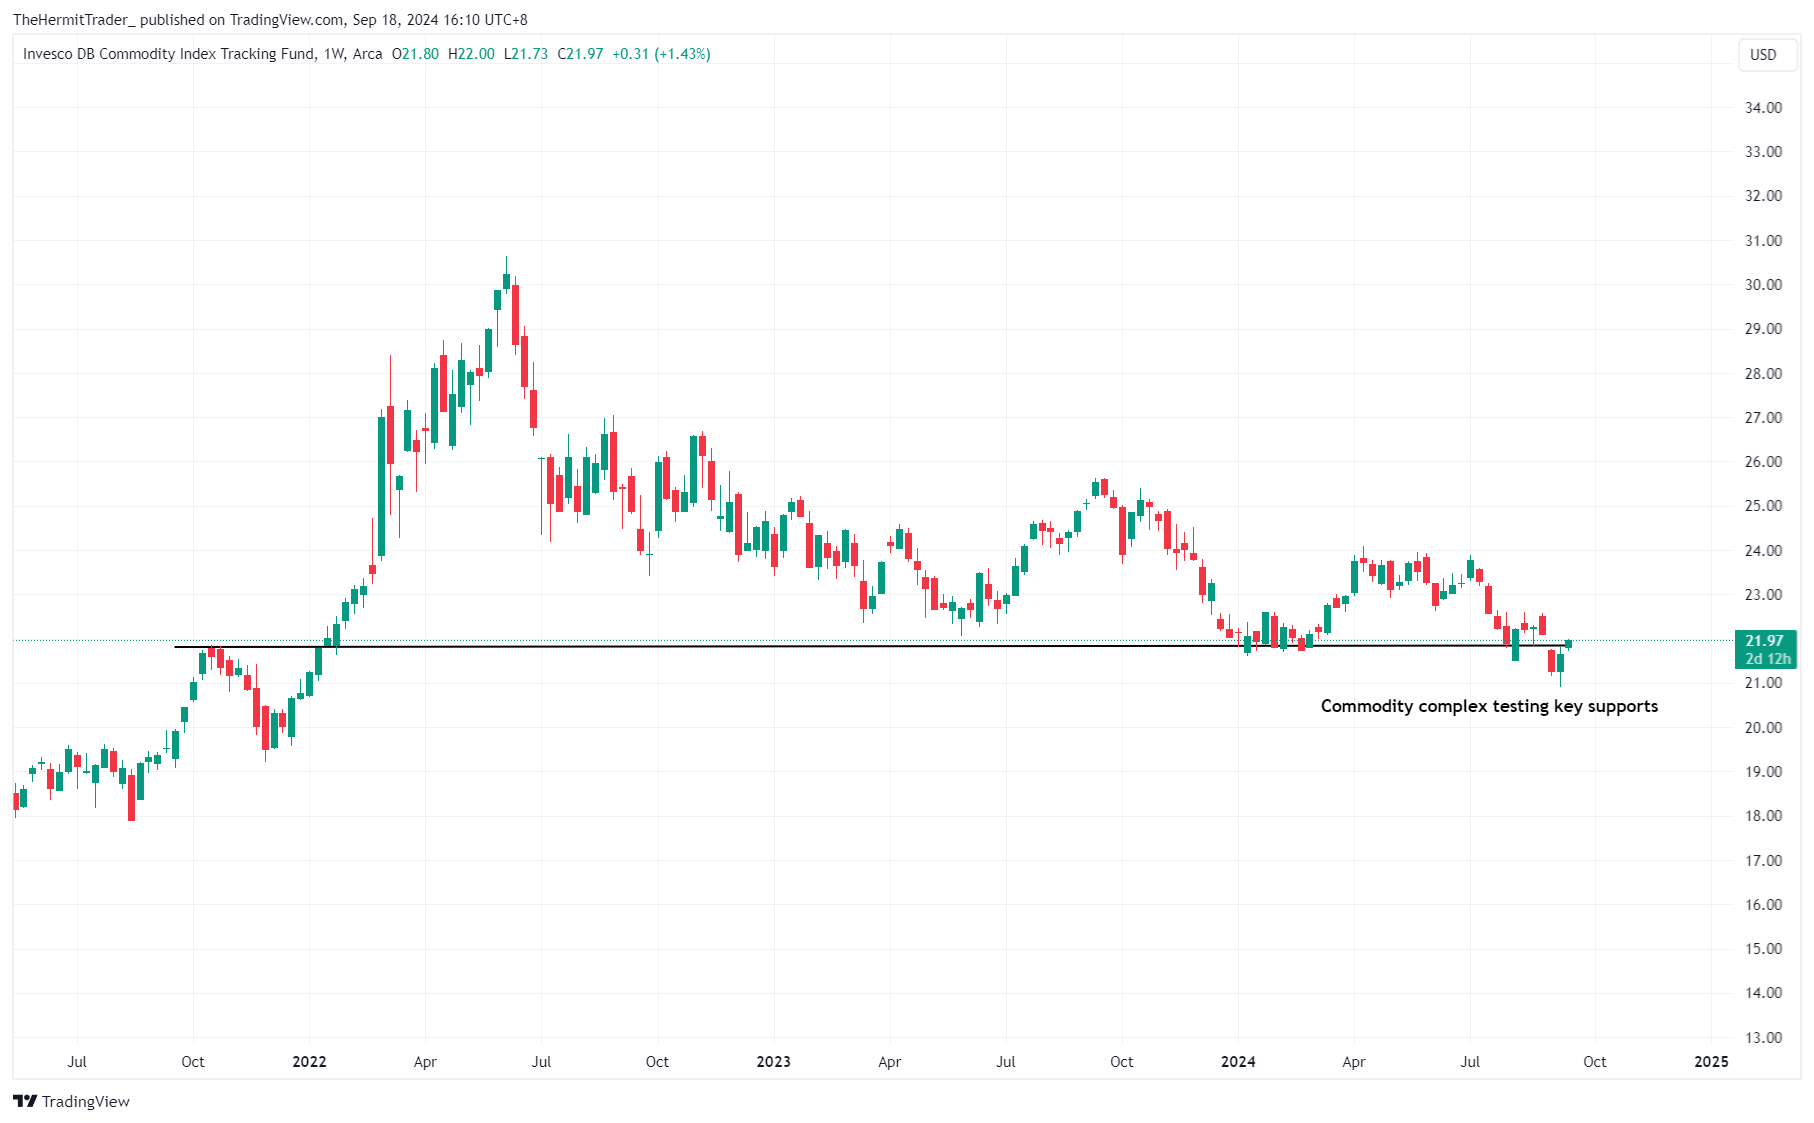
The DB Commodity Index (DBC), which is an aggregate of spot commodity prices, is testing key multi-month support. After a -28% fall from their 52-week highs, odds are rising that we see a multi-week rebound from here.
Weekly Chart: DBC
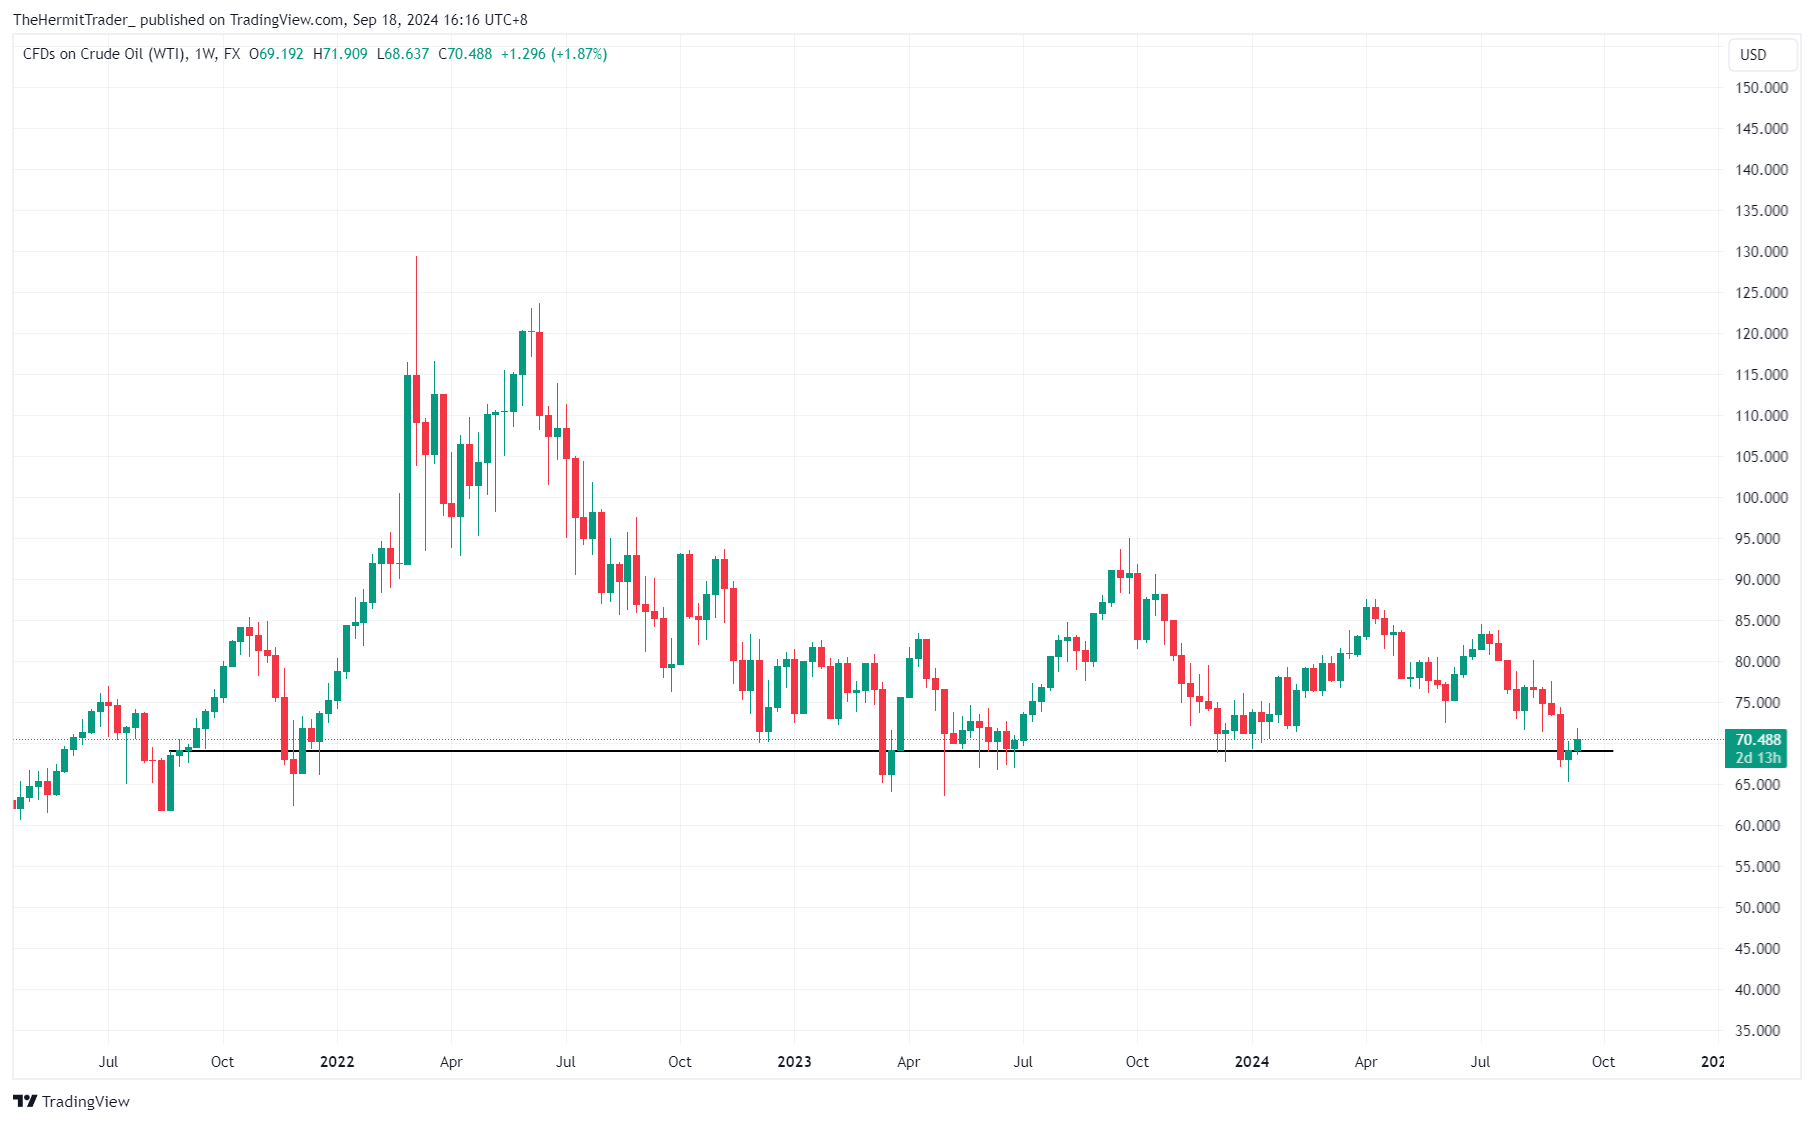
WTI crude oil is also testing key multi-month support levels.
Weekly Chart: WTI Crude
When we break the commodity complex down to the individual sectors, we can see that there is scope for cyclical, inflationary commodities like energy, base metals, and agriculture to start outperforming disinflationary precious metals.
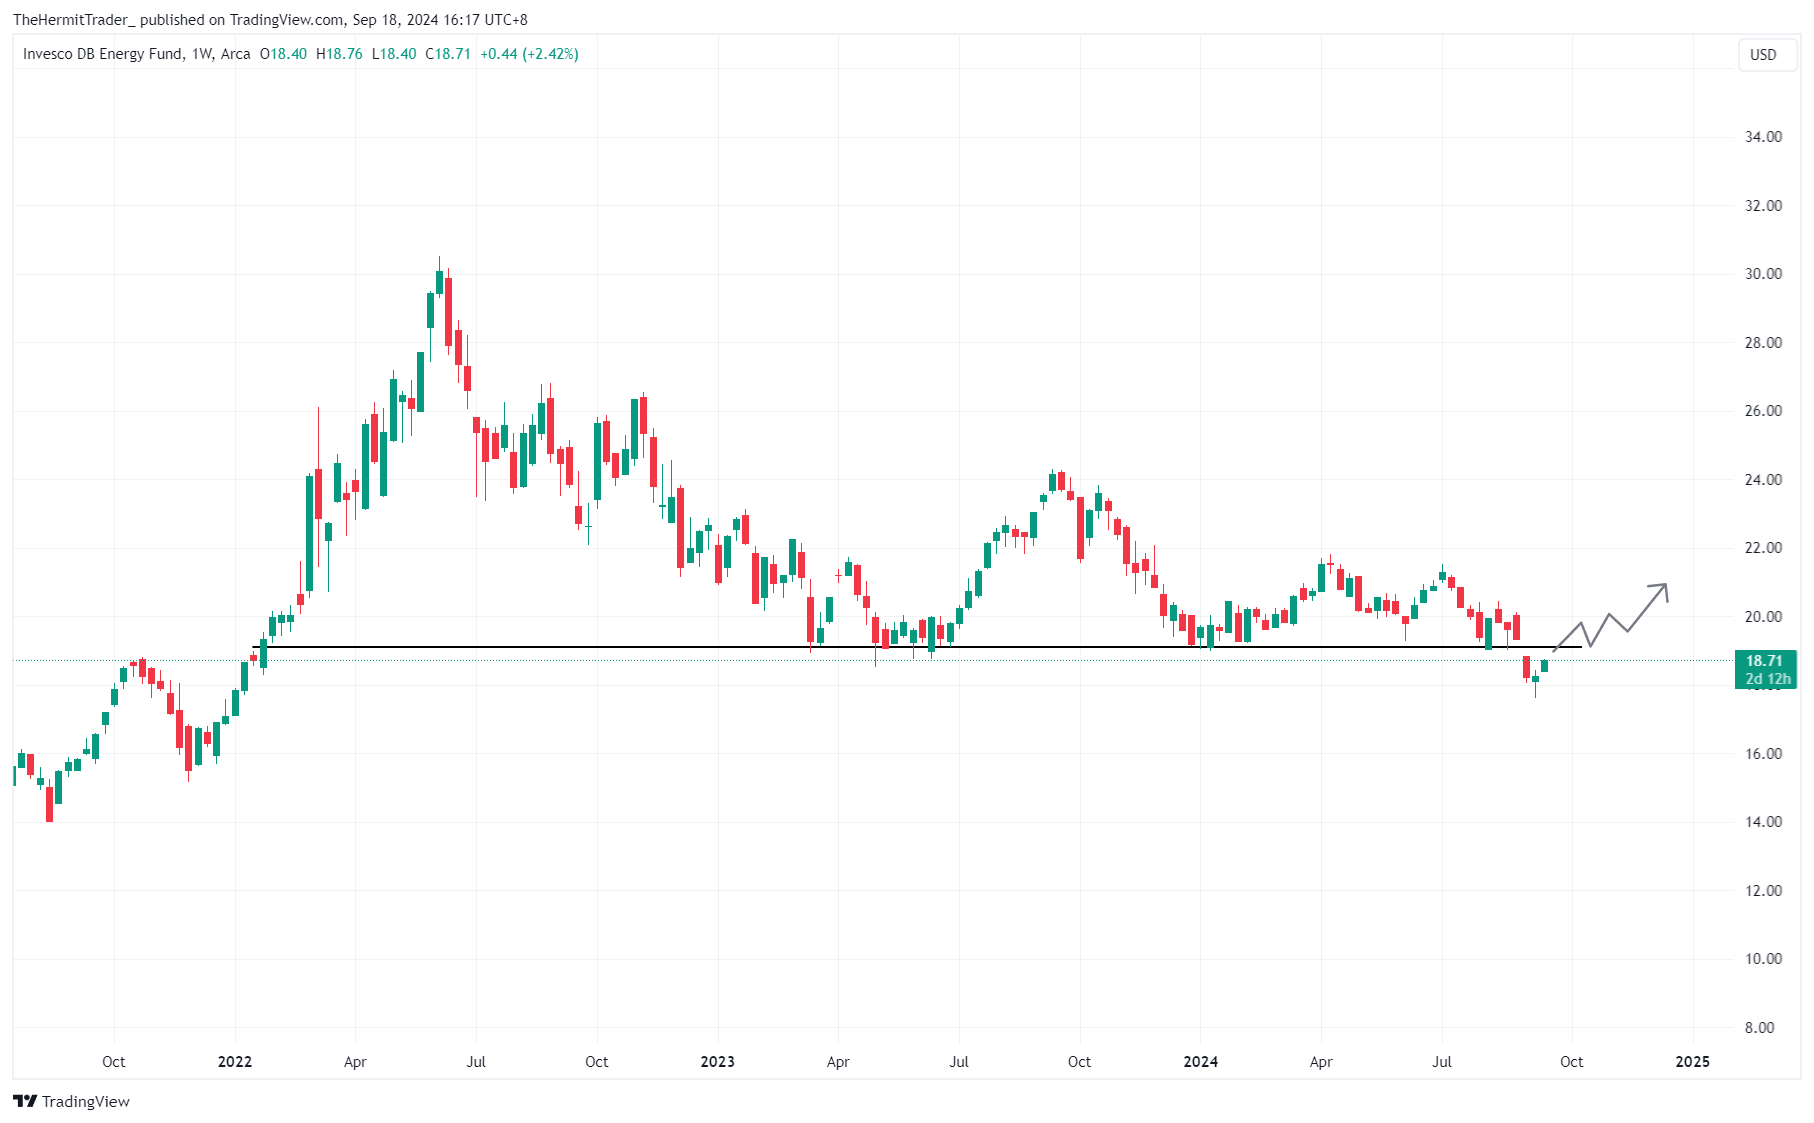
Energy (DBE) – potential for a false breakdown, and I am watching for a swift rebound from here, especially if WTI crude shapes up.
Weekly Chart: DBE
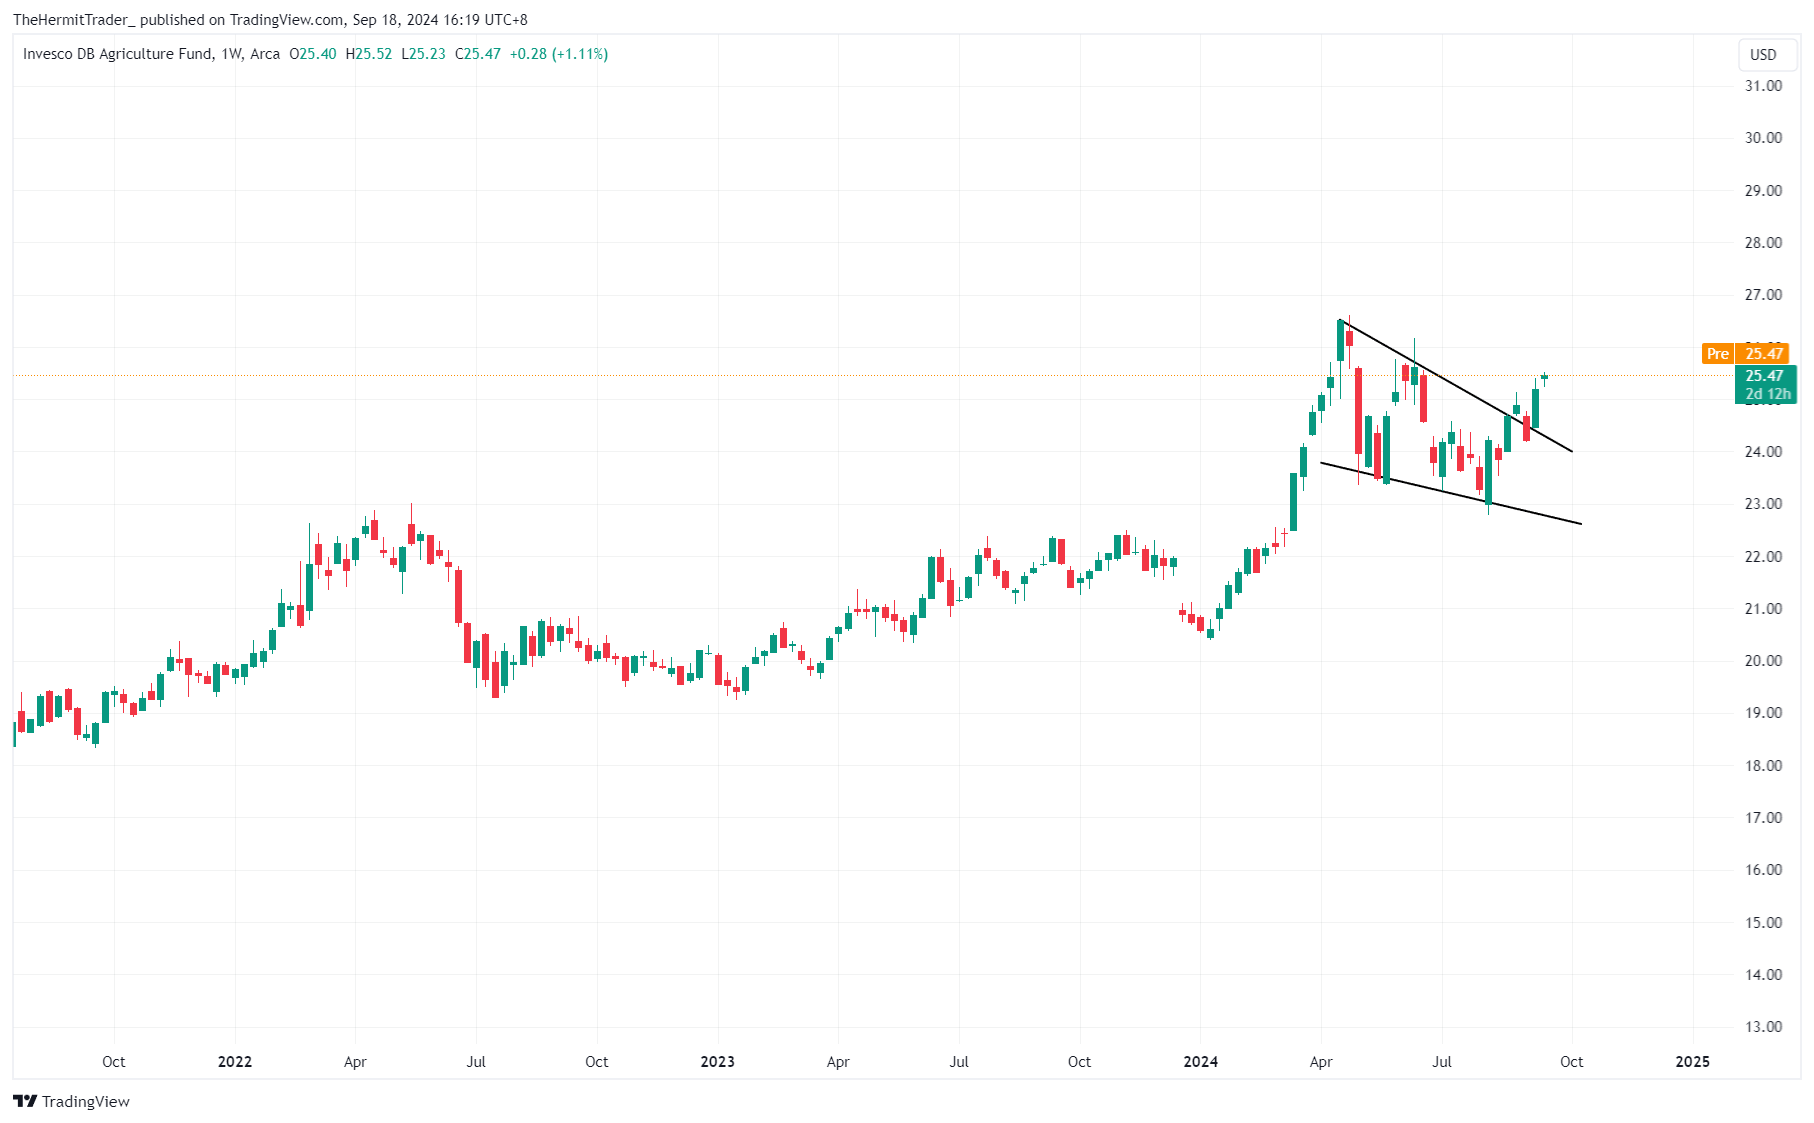
Agriculture (DBA) has broken out from a wedge pattern, moving towards new highs. Does not look like disinflation to me.
Weekly Chart: DBA
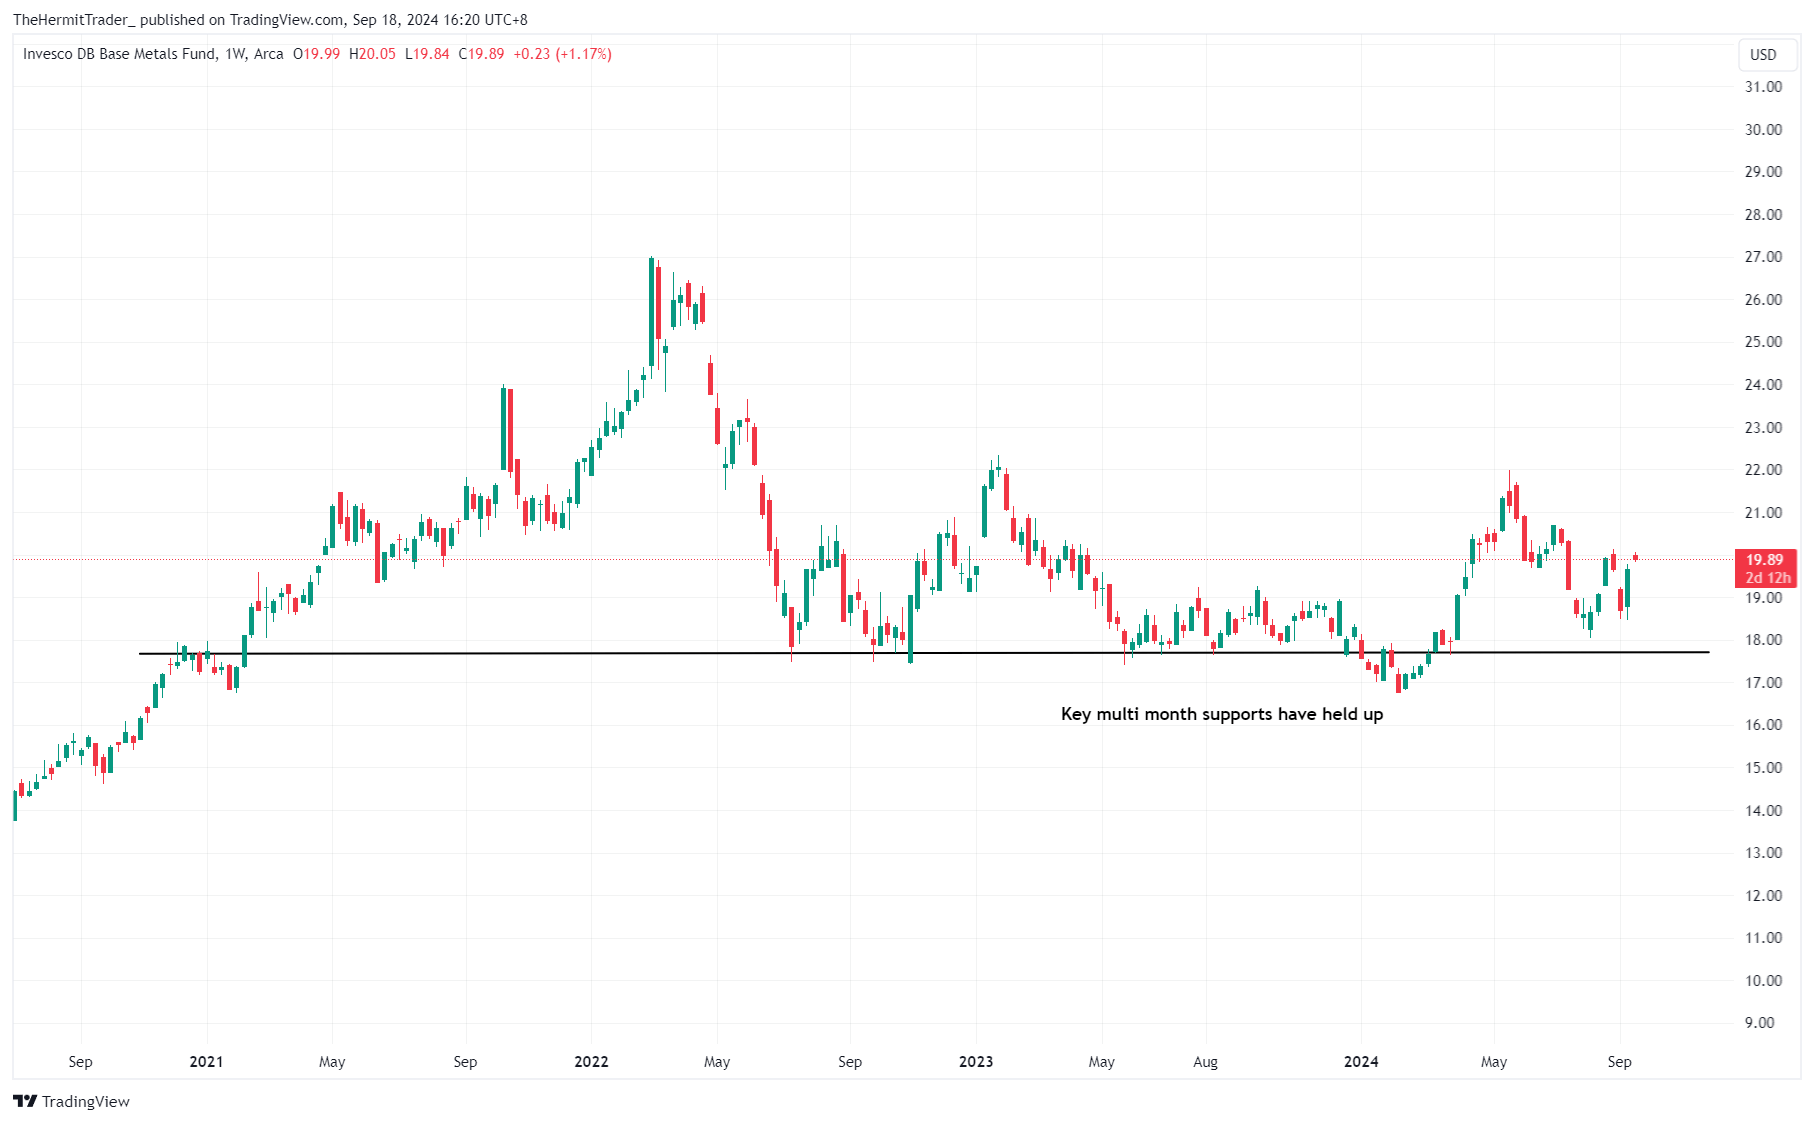
Base metals (DBB) – key multi month supports have held up well.
Weekly Chart: DBB
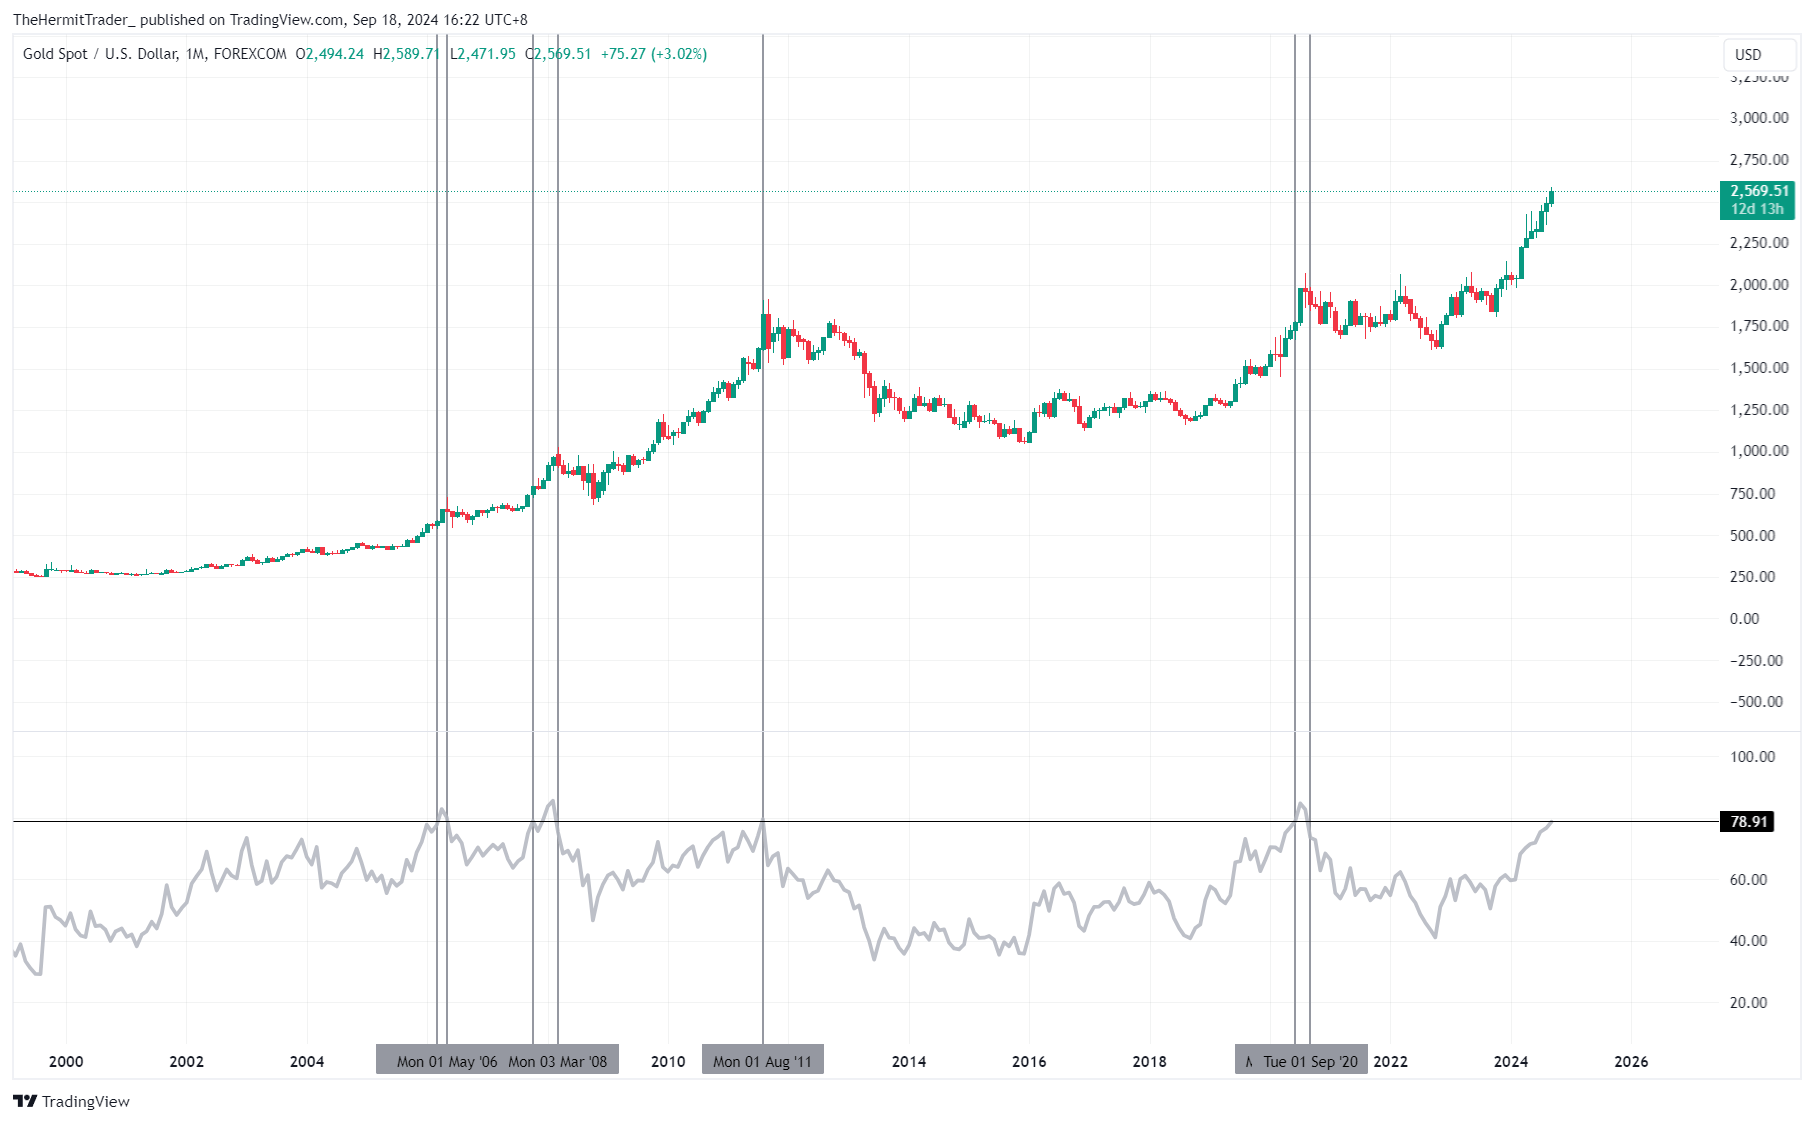
This brings me to the monthly chart of gold, which has certainly benefited from rising rate cut expectations.
The long-term chart looks stretched, with the recent trajectory getting slightly exponential. The lower panel shows the monthly RSI, which has only been surpassed 4 times since 2006 – all these times have marked medium-term tops in gold prices.
Monthly Chart: Gold
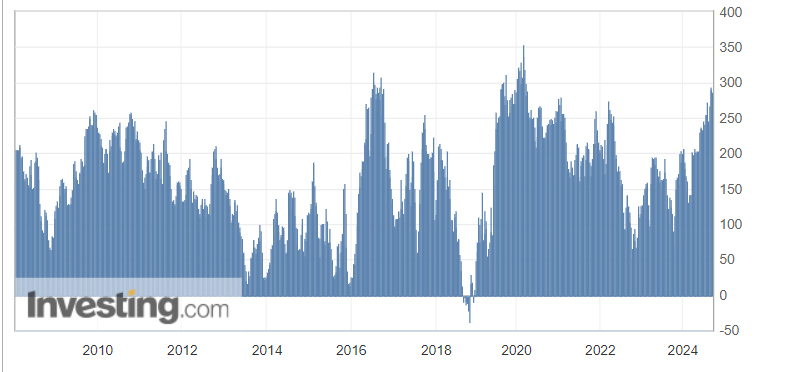
Gold positioning shows that the market is quite net long, with positioning only more overbought during Brexit 2016 and Covid 2020. Both times have led to medium-term declines in gold prices.
CFTC Gold Speculative Net Positions
All in all, as we await September’s FOMC meeting, gold looks like a stellar asset class – optically on its chart, and backed by market expectations of disinflation and rising rate cut probabilities.
However, when we look at related macro asset classes, and how extreme these market expectations are currently, then we may conclude that the risks of being long gold here have outweighed the potential reward.
Analyst’s Disclosure: I/we have a beneficial short position in the shares of XAUUSD:CUR either through stock ownership, options, or other derivatives. I wrote this article myself, and it expresses my own opinions. I am not receiving compensation for it (other than from Seeking Alpha). I have no business relationship with any company whose stock is mentioned in this article.
Seeking Alpha’s Disclosure: Past performance is no guarantee of future results. No recommendation or advice is being given as to whether any investment is suitable for a particular investor. Any views or opinions expressed above may not reflect those of Seeking Alpha as a whole. Seeking Alpha is not a licensed securities dealer, broker or US investment adviser or investment bank. Our analysts are third party authors that include both professional investors and individual investors who may not be licensed or certified by any institute or regulatory body.
Shared by Golden State Mint on GoldenStateMint.com