 Yommy8008/iStock via Getty Images
Preamble
Since the price of gold was around $2,006 six months ago, we can say that the metal has risen by a whopping 25% over this period. Why such a big rise? Yes, there are a lot of geopolitical shenanigans going on, or is the USD heading lower. Personally, I believe it is a combination of the two. I’m also of the opinion that once the investment community fully appreciates the direction the US empire is heading, gold will go to the mooooooon!
In the past couple of years, there has been the steady drumbeat of articles suggesting that the US is paralleling the Roman Empire into decline. But, it’s not just the Roman Empire that the US appears to be copycatting, there are some similarities to the collapse of other empires, such as the Ottoman Empire, the Weimar Republic and, more recently, the British Empire. There is one thing that unites the mentioned collapsed empires, a nosedive in the value of their currencies relative to gold.
Debt and currency debasement often go hand-in-hand in the decline of empires, which then boosts the value of gold in their respective currencies. As governments struggle to finance social stability or their ambitions, which typically involves wars, they may resort to printing more money, leading to inflation and the erosion of their currency’s value. This pattern was evident in the Roman Empire, the Ottoman Empire, and even the more recent British Empire, where excessive debt and the loss of confidence in their currencies contributed in no small extent to their eventual downfall.
The US today faces a growing mountain of debt, and concerns are growing about the potential for currency debasement. If the government continues to rely on deficit spending and the Federal Reserve maintains loose monetary policies, it could trigger inflation and a decline in the dollar’s value. This scenario could have serious repercussions for the US economy, potentially undermining its global standing and leading to a loss of confidence in its financial system.
In this article, I cover a number of signposts that indicate that the US has the potential for a downward spiral, beginning with the implications of the current trajectory of the debt-to-GDP ratio and the consequences of US dollar depreciation for the price of gold.
Debt-To-GDP Ratio
After the devastation of World War II, the UK’s debt-to-GDP ratio soared to a staggering 250%, a colossal burden that cast a long shadow over the nation’s economic recovery. This massive debt overhang severely constrained the government’s ability to invest in infrastructure, education, the military and social programs, thereby accelerating the demise of the UK’s influence around the globe.
The strain on the British economy was immense, resulting in sluggish growth, high unemployment, and persistent balance of payments crises. The situation reached a critical point in the 1960s when the UK was forced to turn to the International Monetary Fund for a bailout, a humiliating blow to an empire that only a hundred years ago ruled over 24 percent of the Earth’s total land area.
The effect on the value of the British pound versus gold, which, in large part, resulted from the decline of the empire and humongous national debt, was truly astonishing. If we look at the price of gold shortly after the end of the Second World War, say 1946, it traded at $38.25. At that time, the British pound was $4.03 v the USD.
So, the price of one ounce of gold in GBP in 1946: $38.25 / $4.03 per GBP = 9.49 GBP
Current price of gold in GBP using the latest conversion rate of GBP = $1.27 we get the following: Current price of gold in GBP: $2,500 / $1.27 per GBP = 1,968.50 GBP
If we subtract the price of gold in 1946 and today’s price, we get 1,959.01 GBP.
To get the percentage change is a simple calculation.
Percentage change since 1946 = (1959.01 GBP / 9.49 GBP) * 100 = 20,642.89%
Japan Debt-To-GDP Ratio
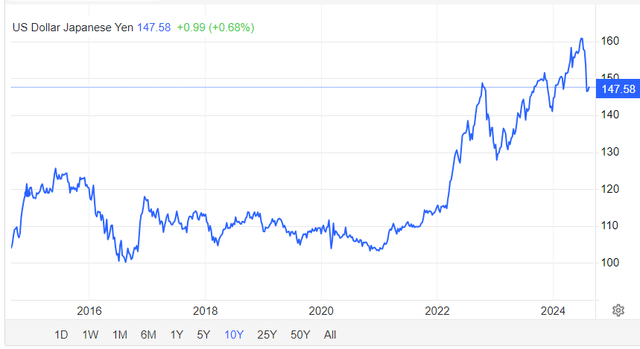
Another country with a high Debt to GDP ratio is Japan, and, at the moment, it stands at 263%. The country’s currency, the Yen, has been in the news quite a bit recently, as the carry trade has been highlighted as a reason for the selloff in stocks last week. The historically low-interest rates in Japan have made it an attractive funding currency for carry trades. Traders borrow yen at low rates and invest in higher-yielding assets, often denominated in other currencies, such as the US dollar. This creates a substantial short position on the yen.
The massive debt-to-GDP ratio amplifies these dynamics. Many traders believe the Japanese government is constrained in its ability to raise interest rates due to the already immense debt servicing costs. This reinforces the expectation of continued low rates, making the yen even more attractive for carry trades.
Last week, traders were spooked because the Japanese government increased interest rates by a quarter of a percent, leading to a sell-off in stocks. But now, there are reports that traders are turning back to the carry trade as they are convinced that the Japanese government cannot increase rates given that this would lead to a massive uptick in servicing costs.
These short positions have led to a fall in the value of the Yen v the USD, and so in Yen terms, gold has had an even greater rise than gold v the USD.
 Yen v USD (Trading Economics)
US Debt-To-GDP Ratio
I’m certain everyone by now is familiar with the new figure for the national debt, which stands at around $35 trillion, and that the debt-to-GDP ratio is approximately 122%. I’m equally confident that most readers have heard that the debt is increasing at circa $3.6 trillion a year.
Given that the debt is increasing at such an alarming rate, it would be interesting to calculate how soon the debt-to-GDP ratio could hit 200%, which is bad news for a national currency.
First, let’s calculate the Compound Annual Growth Rate (“CAGR”) in the rise of the debt, from say 2018 to now, using the $35 trillion figure.
Between 2018 and today 2024, debt increased by around $13.6 trillion ($35.167 – $21.516), so we get a CAGR of 8.5% over the last 6 years.
CAGR = (Ending Value / Beginning Value) ^ (1 / Number of Years) – 1
((35 / 21.516) ^ (1 / 6)) – 1 = 8.5%
Now let’s figure out the CAGR in the rise of GDP over the same period.
In 2018, GDP was $20,656 trillion and, in 2024, the latest estimate is that it will be $28,176 trillion.
Using the same formula as above, we get a CAGR of 5.31%, assuming the 2024 estimate holds true.
(($28,176 trillion / $20,656 trillion) ^ (1 / 6)) – 1 = 5.31%
So, we can conclude that debt is rising 3.2% faster than GDP. Let’s now assume that GDP remains constant and debt rises by 3.2% in order to calculate an estimate of the time it will take for the debt-to-GDP ratio to get to 200%.
| Year | Debt (trillions) | Increase in Debt (trillions) | Debt-to-GDP Ratio |
| 2024 | $35 | – | 125% |
| 2025 | $38.72 | $3.72 | 138% |
| 2026 | $42.55 | $3.83 | 152% |
| 2027 | $46.52 | $3.97 | 166% |
| 2028 | $50.63 | $4.11 | 181% |
| 2029 | $54.88 | $4.25 | 196% |
And the answer is; 5 short years. Of course, this is a back-of-an-envelope calculation, debt could accelerate further due to the various conflicts taking place around the world or an increase in social costs, such as the billions needed to pay for newly arrived migrants. It is also possible that the government could control spending as the debt balloons out of control.
There are some who may, quite rightly, point out that debt is not so bad if a country can afford the interest on the loans. As of today, the US pays circa $870 billion in interest and given that Federal Revenues are estimated to be $4.864 trillion for FY 2024, the percentage of revenues is about 17.88%.
But, as the debt-to-GDP ratio rises towards 200%, that 17.88% is going to rise more than a tad. When this happens, the country may face pressures similar to those experienced by the UK, potentially leading to cuts in spending on infrastructure, education, the military, and social programs.
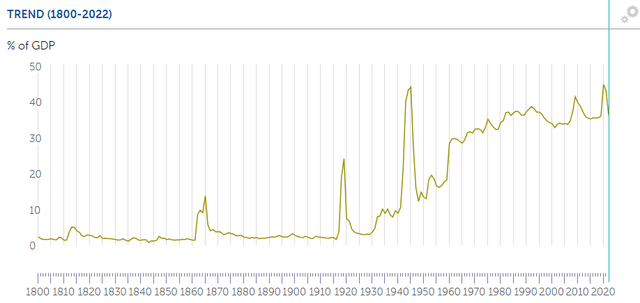
Then there is a problem with the number for GDP, and that is that around 35% of the figure is government spending, which has been increasing, as the IMF data below illustrates. So, it seems that the US government is dealing with some economic hardships by boosting spending. This is similar to the Weimar Republic, which also faced the classic dilemma, either cut government spending in an attempt to balance the books or increase it in an attempt to juice-up the economy.

Government Spending As A Percentage Of GDP (IMF)
The Ottoman Empire
There is a study of the debasement of the currency used in the Ottoman Empire freely available for those interested. This work discusses a number of issues that contributed to the eventual collapse of the Empire in 1922, three of which I will highlight and their parallels in the US today.
On page 25 of the text, you can find reference to the debasement of the Ottoman currency, which led to a decline in purchasing power of 83% relative to other European currencies, and, by implication, a rise in the value of gold in that currency.
Since there was this intentional debasement, lenders to the Empire began to lose their enthusiasm for loaning money in return for a currency consistently losing value (Page 28).
Finally, some economic historians; “argue that free trade contributed to deindustrialization in the Ottoman Empire. In contrast to the protectionism of China, Japan, and Spain, the Ottoman Empire had a liberal trade policy, open to imports.” Of course, a decline in exports would naturally lead to a lower demand for the currency, thus contributing to the decline in purchasing power.
Parallels To The Ottoman Empire
Back in the days of the Roman and Ottoman Empires, currencies would be debased through the reduction of the amount of silver in a coin. The US does things differently, but the effect is the same.
To increase the money supply, a form of monetary policy known as quantitative easing (“QE”) is used. With this technique, the Federal Reserve purchases securities in the open market, which increases the money supply, effectively, debasing the dollar.
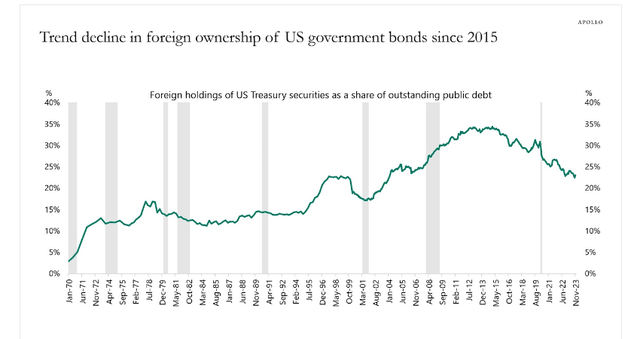
In recent years, trillions of dollars have been magicked into existence through the miracle of QE. Seemingly; “$3 trillion in 2020 alone.” As with the Ottoman Empire, many buyers are losing their enthusiasm for buying US debt, as the chart below confirms.
 Foreign Holdings Of US Bonds (Apollo Academy)
According to some researchers; “Reports of American manufacturing’s death, however, are greatly exaggerated. While it is undeniably true that certain manufacturing industries—particularly labor-intensive, low-tech ones—are no longer primarily located in the United States, many other, more advanced ones have flourished.”
However, in my humble opinion, the market for US companies is shrinking, which I have covered previously. For instance, primarily as a result of US sanctions on China, according to a report by the Federal Reserve Bank of New York, the US semiconductor industry has lost business in the Chinese market which may not recover due to homegrown Chinese companies filling the gap left by US companies.
If indeed the international market were indeed shrinking for US products and services, you would expect revenues to decline in markets outside the US. According to research by FactSet; “S&P 500 Companies With More International Exposure Reporting An Earnings Decline of -21%.” And this, despite a weaker dollar. Of course, there are other potential reasons for this drop, such as a weak global economy, but it does support my thesis.
Supply Chain Issues
The British Empire, now known simply as the United Kingdom, faced many supply chain issues, most of which began during World War 2. German submarines torpedoed ships bringing raw materials to British industry. Then many countries of the empire became independent, beginning with India in 1947. This meant that the UK had to compete with other countries for the commodities these countries produced for UK manufacturing.
Now the US is also facing challenges with supply chains. I’ve previously discussed difficulties being faced by the nascent US battery industry due to the supply of graphite being choked off. Now, China has imposed restrictions on the supply of antimony, which is important for the manufacture of many products, including a host of different weapons systems.
Given the recent sabre rattling between the US and China, one wonders when the Chinese may stop supplying the 41% of parts necessary to produce US weapons systems.
Others
There are other parallels I could draw, such as loss of technological edge (Check out Intel v TSMC) and political polarization.
In addition, there are ongoing discussions among BRICS countries for an alternative to the dollar and many countries are opting to trade in national currencies, but I think readers have already got the picture.
Summary
The primary focus of the article is the potential decline of the US and its parallels to historical empires.
The rising US debt-to-GDP ratio, coupled with other factors such as a shrinking international market and supply chain vulnerabilities, raises concerns about the future of the US dollar and the potential for a significant increase in the gold price.
The recent rise in the gold price could be an early indicator of these underlying issues, and I maintain my view that gold could see further substantial gains as the market fully grasps the implications of the US’s current trajectory.
Shared by Golden State Mint on GoldenStateMint.com


