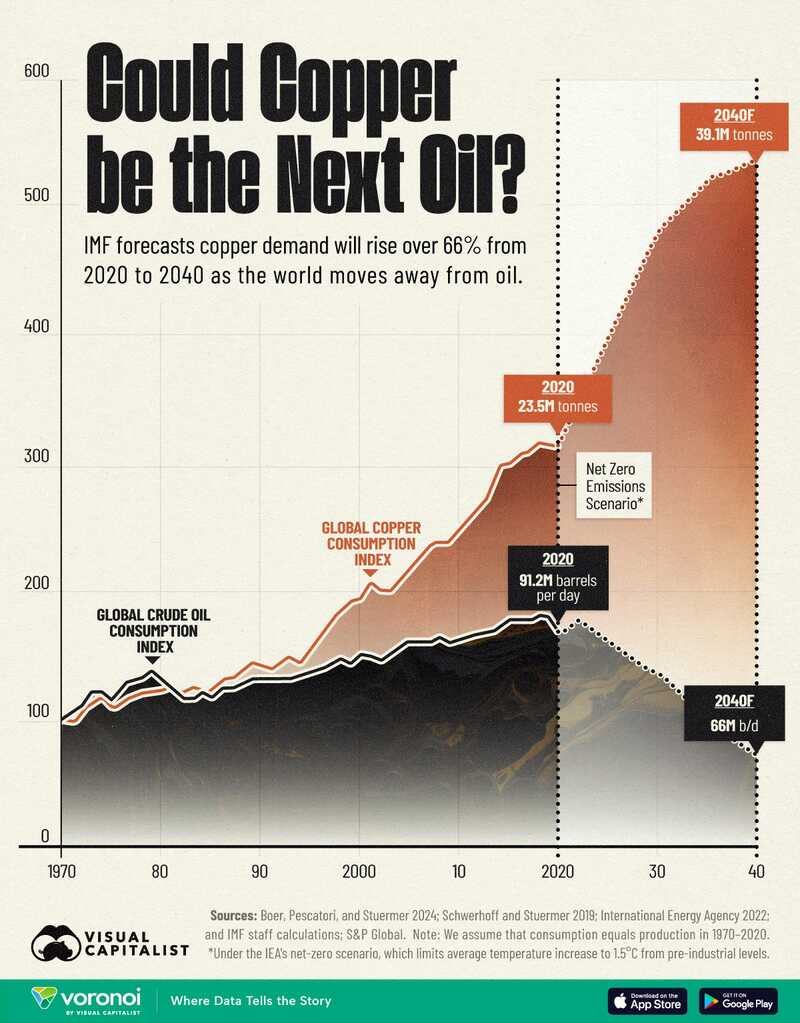
Visual Capitalist, a publisher known for its amazing economics-focused infographics, recently released an eye-catching infographic titled “Could Copper Be the Next Oil?” This title stems from Goldman Sachs’ description of copper as “the new oil” due to its critical role in clean energy technologies.
In 2023, the IMF projected a 66% increase in copper demand from 2020 to 2040 as the global shift away from oil gains momentum.
The infographic below highlights how copper demand is expected to rise significantly in the coming decades, while oil consumption is predicted to decline.
Copper plays a vital role in numerous applications, including the electrical grid, electric vehicles (EVs), and renewable energy technologies. In addition to its importance in clean energy, copper is widely used in sectors such as construction, infrastructure, and defense, thanks to its exceptional properties.
Under a net-zero emissions scenario aimed at limiting global temperature increases to 1.5°C above pre-industrial levels, global copper demand is expected to rise significantly, from 25.9 million tons in 2023 to 39.1 million tons by 2040.
A significant portion of this growth is anticipated to come from the electric vehicle industry, where copper is a critical component. Battery electric vehicles, on average, contain 60-83 kilograms of copper—four times the amount used in internal combustion engine vehicles, which typically require only 15-20 kilograms of copper per car.
In contrast, oil consumption is projected to decline significantly, falling from 101.9 million barrels per day in 2023 to 66 million barrels per day by 2040.
This decrease is fueled by global efforts to cut carbon emissions, the rapid adoption of renewable energy, and advancements in energy efficiency. Stricter policy regulations are also playing a key role in reducing oil demand.
Earlier this year, French billionaire and commodities trader Pierre Andurand predicted that copper prices could soar to $40,000 per ton in the coming years—a more than fourfold increase from the current price of $8,871 per ton:
“We are moving towards a doubling of demand growth for copper due to the electrification of the world, including electric vehicles, solar panels, wind farms, but also military usage and data centers,” he told the Financial Times.
So, what does booming copper demand have to do with silver? The connection lies in the significant influence copper prices have on silver prices. While silver is often associated with gold, its behavior and demand profile are better understood as a blend of precious metal and an industrial metal.
In reality, the prices of copper and silver are highly correlated. Major shifts in copper prices—whether upward or downward—often have a corresponding impact on silver, pulling it along for the ride.
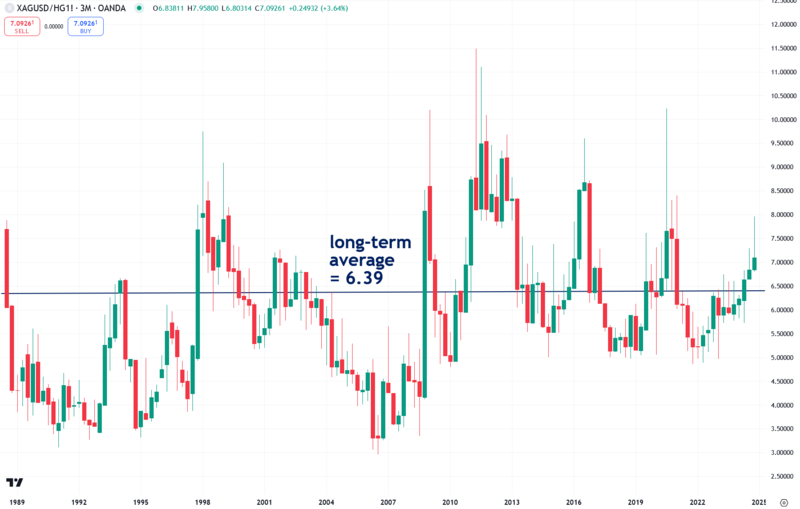
The strong price relationship between silver and copper is evident in long-term charts of the silver-to-copper ratio. This ratio has demonstrated remarkable consistency over time, despite fluctuations around its historical average of 6.39.
I recently analyzed the data and confirmed what many already suspected: gold and silver indeed share a strong correlation. Over the past five years, their correlation has been a solid 0.771 (out of 1), increasing to an even stronger 0.917 over the past year.
What’s particularly notable, however, is the strong correlation between copper and silver—.725 over the past five years and an impressive .878 over the past year. This high correlation is why silver investors should keep an eye on copper in addition to gold.
The close relationship between silver and copper stems from shared factors affecting both supply and demand.
On the supply side, silver is rarely mined as a standalone metal; instead, it is typically a byproduct of mining operations for copper and other metals such as lead, zinc, and gold.
On the demand side, both silver and copper have substantial industrial applications, driving significant industrial demand for both metals.
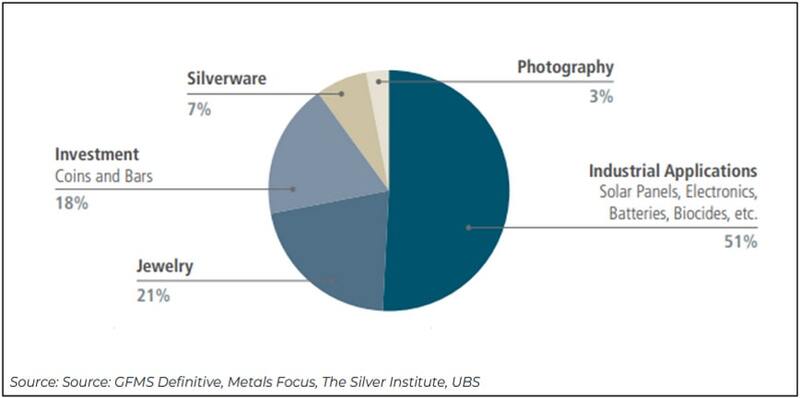
While silver is typically associated with gold, its demand profile is quite different. The majority of silver demand (51%) comes from industrial use, compared to just 18% from investment. Additionally, the rapid growth in industrial demand for silver likely explains the rising correlation between silver and copper in recent years.
Gold demand, by contrast, is primarily driven by investment (44.57%) and jewelry (48.74%). Notably, a significant portion of jewelry demand, particularly in developing countries like India and China, is also considered a form of investment.
Due to their substantial industrial demand, copper and silver are far more sensitive to economic cycles than gold. During economic expansions, their prices typically rise in anticipation of increased industrial demand.
Conversely, as recessions loom, copper and silver prices often decline due to expectations of reduced industrial demand.
Gold, by contrast, is traditionally regarded as a safe-haven asset, attracting investors seeking stability during times of crisis.
The strong price relationship between silver and copper is likely reinforced and amplified by trading algorithms that anticipate movements in one metal based on the price of the other, often creating a self-fulfilling prophecy.
For example, when copper begins to rally, certain algorithms will buy silver, causing the two metals to track each other closely.
Although anecdotal, I’ve often observed silver track copper even more closely than gold, both on intraday movements and over longer timeframes.
For instance, I’ve often seen silver rise with copper while gold stayed flat or declined, and at other times, I’ve observed silver dropping along with copper even as gold rallied. I’ll highlight a recent noteworthy example of this phenomenon using the charts below.
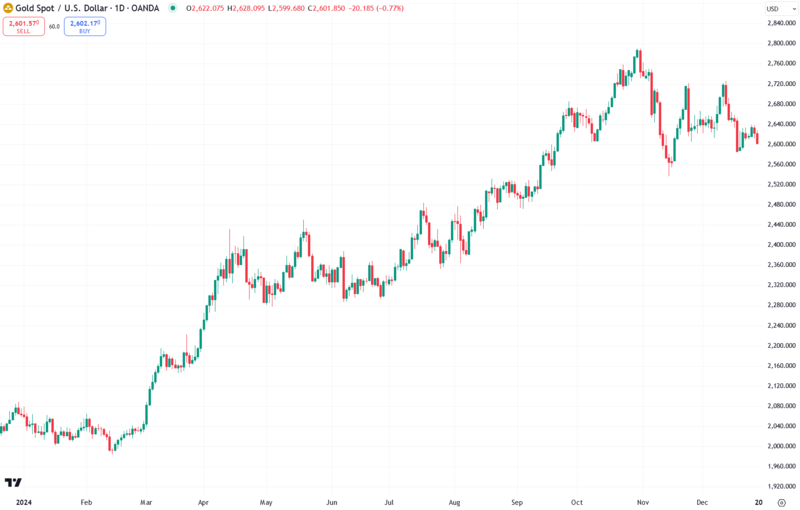
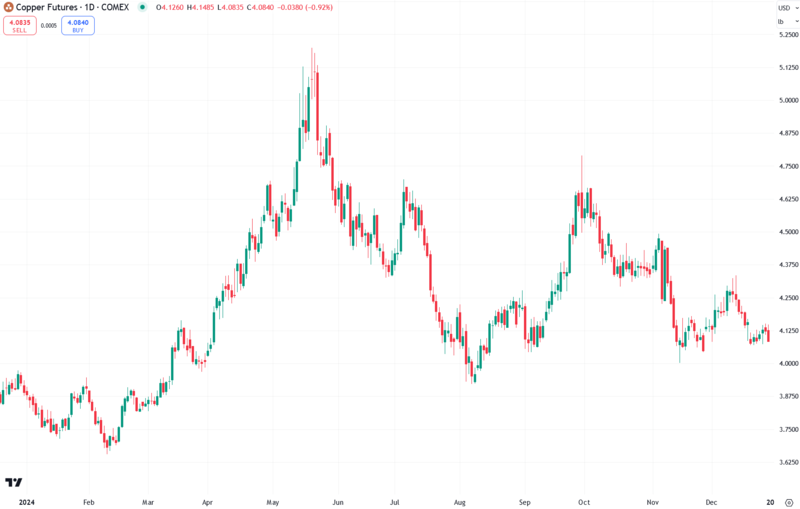
Of the three metals, gold exhibited the highest relative strength and rallied for much of the past year:
Copper, by contrast, peaked in May and again in early October and has been trending downward since then:
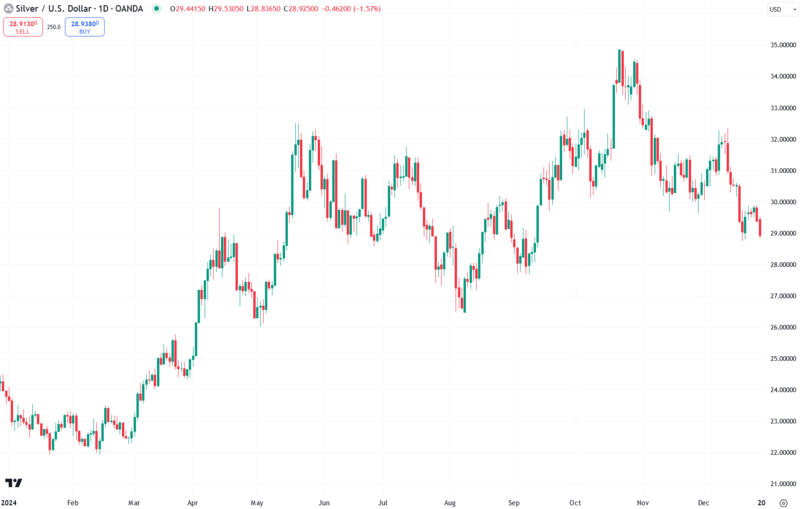
Interestingly, silver has been trading like a hybrid between gold and copper.
Unlike gold, which has been in a strong uptrend over the past year, silver hasn’t experienced the same level of upward momentum. At the same time, it hasn’t declined as sharply as copper has since its peak in May.
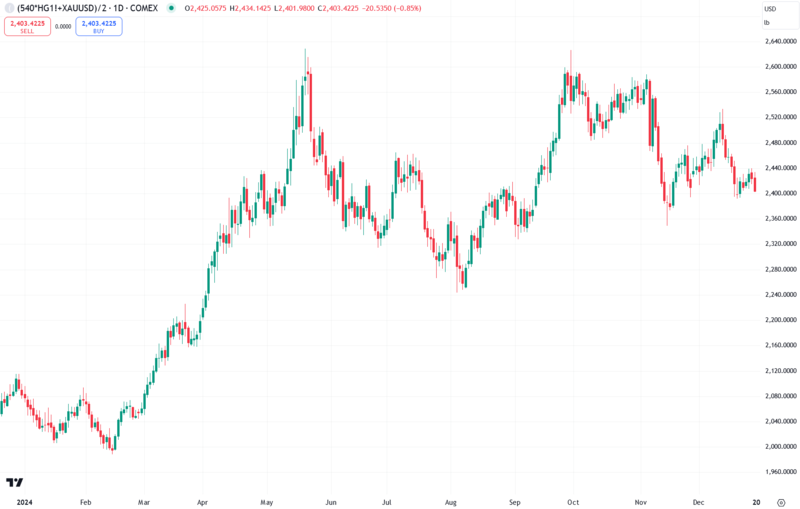
Recognizing that silver behaves like a hybrid of gold and copper, I developed an indicator called the Synthetic Silver Price Index (SSPI) to better validate price movements in silver.
This index combines the average prices of gold and copper, with copper adjusted by a factor of 540 to ensure gold does not disproportionately influence the index.
Despite silver itself not being an input, the SSPI closely mirrors silver’s price movements (see the chart below). The SSPI actually has a stronger correlation with silver prices than the individual correlations between silver and either gold or copper.
From a tactical standpoint, I’m closely monitoring whether the anticipated surge in demand will drive copper prices higher, potentially lifting silver along with it.
In the short term, I’m focused on whether copper can hold support at the critical $4 level and rebound from there. Failure to hold this level could signal further short-term weakness.
However, if copper bounces off $4, the next challenge will be breaking through the overhead resistance zone at $5 to $5.20. A decisive close above this zone would signal the onset of a strong copper bull market.
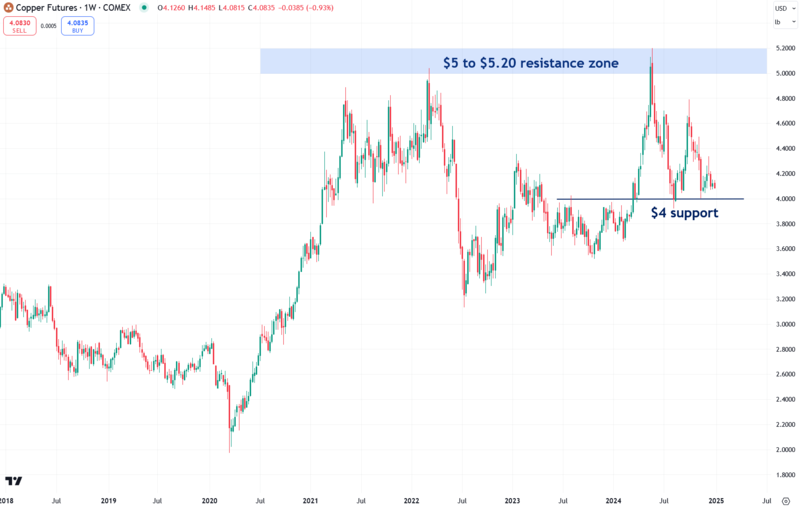
If copper enters a new bull market, it could become a key tailwind that will help silver to break out of its multi-decade cup-and-handle pattern, paving the way for silver to reach several hundred dollars per ounce:
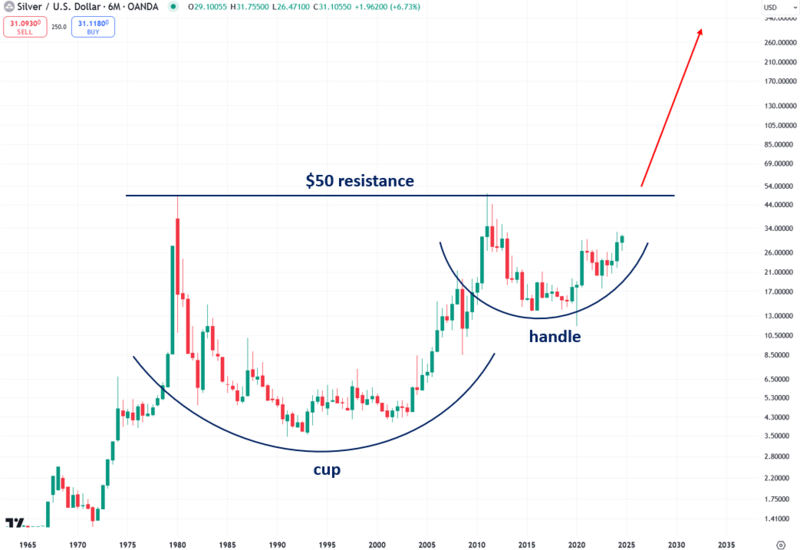
It’s important to recognize that the anticipated copper demand boom is a long-term trend expected to unfold over decades, with limited impact on short-term price movements.
Currently, both copper and silver have been under pressure, largely due to the strengthening U.S. dollar, which typically weighs on commodity prices. Additionally, both metals appear to be priced in a U.S. recession.
On the bullish side, however, a significant catalyst could emerge from a large-scale Chinese stimulus program aimed at reviving its struggling economy. Such programs often focus on boosting infrastructure and development, which historically benefits commodities like copper.
Some may argue that surging copper demand could lead to an oversupply of silver, given that silver is often a byproduct of copper mining. However, the reality is that expanding and developing new mines is a lengthy and complex process, and high-grade copper ore is becoming increasingly harder to find.
This makes it unlikely that large quantities of copper and silver will flood the market. Moreover, industrial demand for silver is also rising sharply, driven by many of the same factors propelling copper demand, such as the growth of clean energy technologies and electric vehicles.
The interplay between copper and silver presents a compelling dynamic for investors and analysts alike. With copper demand poised for long-term growth driven by the global shift toward clean energy and electrification, silver’s strong correlation with copper positions it as a potential beneficiary of this trend.
While short-term price movements may be influenced by factors like currency strength, interest rates, and economic cycles, the broader narrative suggests that silver could gain significant momentum alongside copper in the years ahead.
By understanding the intertwined nature of these metals, investors can better navigate the opportunities and challenges within the commodities landscape.
Shared by Golden State Mint on GoldenStateMint.com


