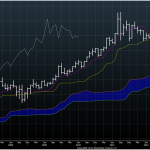
 Likely Precious Metals Uptrend, shows Ichimoku Analysis. Ichimoku, meaning “one look” is a method of charting and analyzing market data that allows easy identification of resistance and support for various financial categories. The Ichimoku Hyo chart was created by Goichi Hosoda of Japan. The chart displays a market equilibrium analysis called Ichimoku Kinko Hyo, which is becoming increasingly popular in the west, due to its long-term accuracy.
Long-term precious metals price trending and momentum in the short-term are defined by the Ichimoku chart, in order to identify price objectives. The chart is developed by using prices at the midpoint and close of each trading day. This data creates a “pattern of signals” to generate a plot. The resulting chart uses twenty-six days into the past and future markets, and generates an analysis with current data.
Gold bullion and, consequently, little brother silver bullion are currently attempting to break through their monthly support levels on the Ichimoku chart. The movement shown by this highly accurate method seems to bode well for a precious metals uptrend in the near future.


