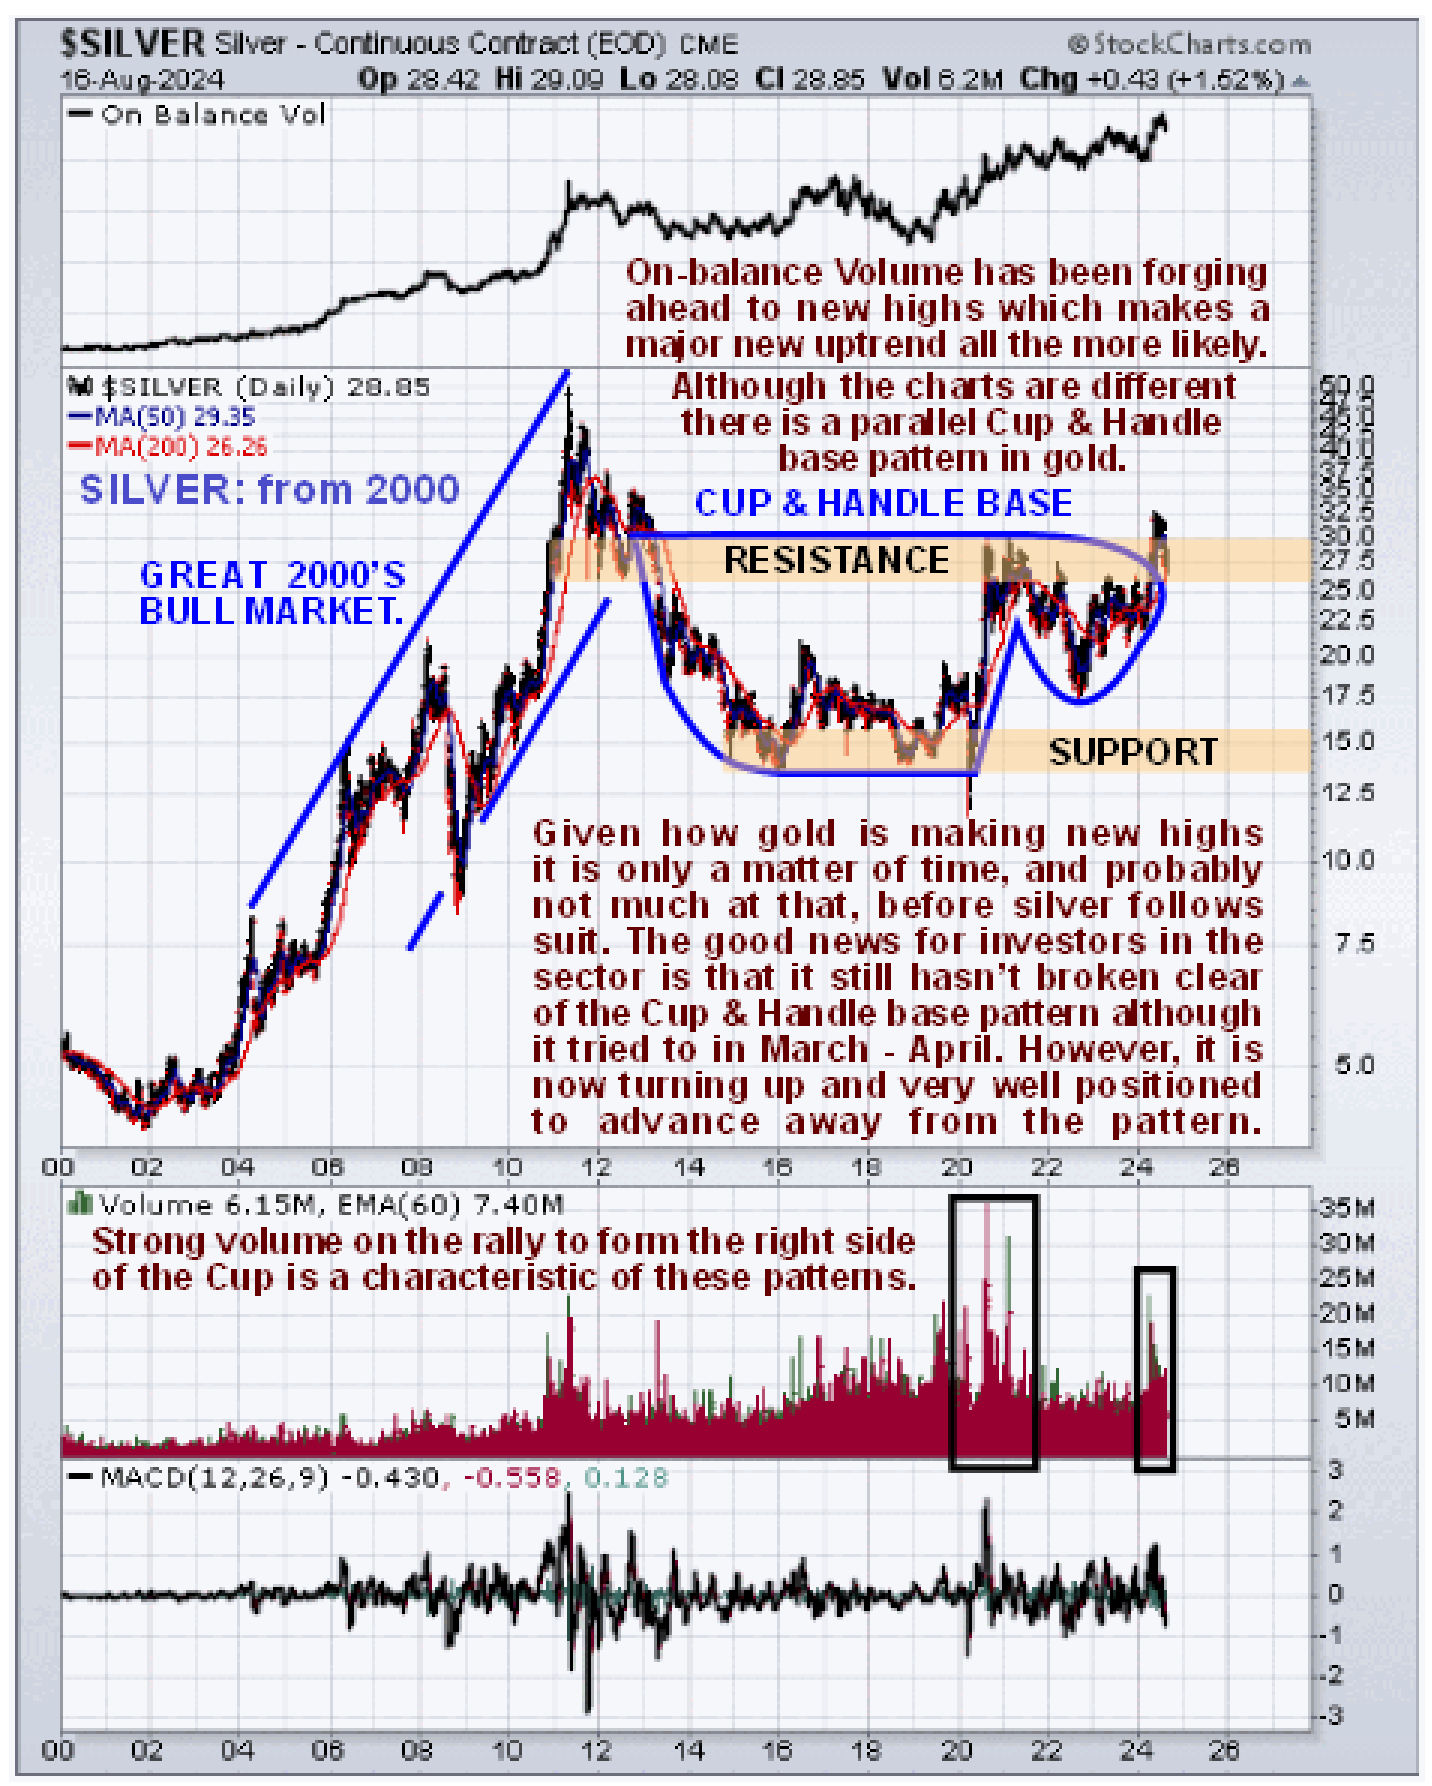
The purpose of this update is to bring to your attention that silver is on the verge of commencing a massive unprecedented bull market which will “officially” kick off with it breaking above the key $30 level, which is important for reasons that will soon become apparent when we consider the charts and this could happen very soon. Gold’s massive unprecedented bull market has already begun and where gold leads, silver will follow.
The reasons for silver’s bull market will be the same as for gold and are well set out by Doug Casey with the link to his recent article Gold’s Next Explosive Move, which is included in the parallel Gold Market update, repeated here for convenience. In the Gold Market update we deduced that, taking inflation over the years into consideration, gold has essentially been stuck in a giant trading range since its 2011 peak, that it only succeeded in breaking out of in the Spring of this year, with this trading range being comprised of an equally gigantic Cup & Handle continuation (consolidation) pattern.
The big difference here between silver and gold is that, while gold has already broken out and is forging ahead, silver has so far only managed a “preliminary” breakout that was followed by a reaction back into the pattern, but with gold striding ahead this is not a situation that can be expected to last much longer and it is already starting higher. WHAT THIS MEANS IS THAT SILVER AND ALL THINGS SILVER ARE A TERRIFIC BARGAIN HERE WITH THESE SORTS OF PRICES NOT EXPECTED TO LAST MUCH LONGER, AND MAY NEVER BE SEEN AGAIN. That the giant Cup & Handle base shown on our long-term chart for silver going back to 2000 is valid is made clear by two important technical factors. One is the strong volume on the rally to form the right side of the Cup in 2020 (and on the attempted breakout this Spring) which is a sign that the pattern is genuine and the other is the strong On-balance Volume line which has been marching steadily higher. Thus the reaction back into the pattern of the past couple of months is seen as presenting the perfect “buy spot” for silver and all things silver ahead of a genuine breakout leading to a vigorous bull market especially given the serious escalation of military conflict in different theaters around the world that we are now right on the verge of.
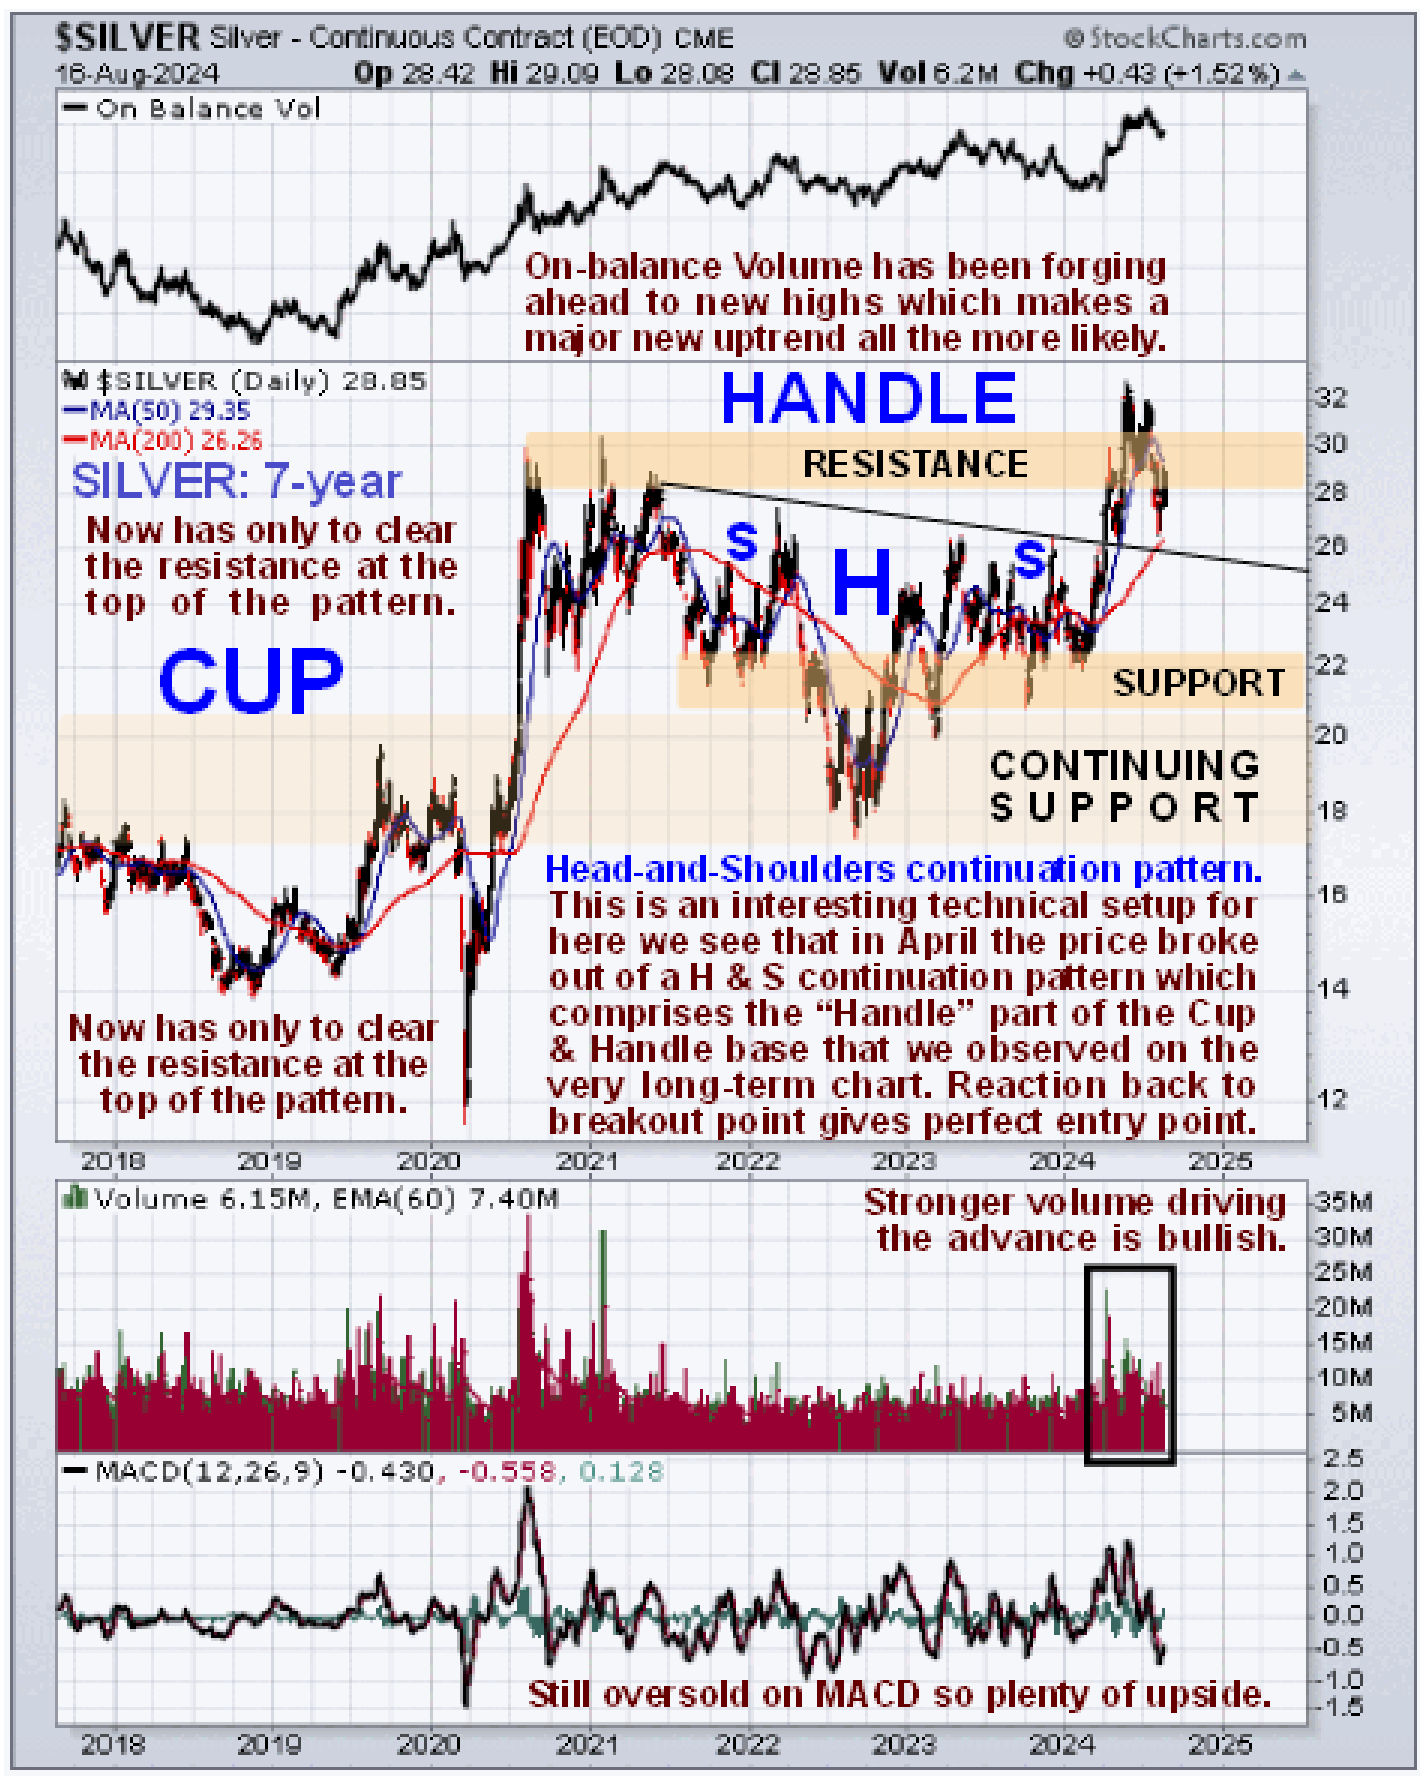
 Zooming in now via a 7-year chart, which shows the right side of the Cup and the subsequent “Handle” in much more detail, we can see that the Handle has been comprised of a Head-and-Shoulders continuation pattern with the price staging a clear breakout from it in April, in sympathy with gold’s advance, and this breakout has been followed by a normal reaction back to a classic “buy spot” at support at the upper boundary of the H&S pattern and although it is starting to advance again, we are clearly in a very good buying area here with silver still oversold on its MACD. After the price broke out in April it drove through the key $30 level, but due to overhead resistance – recall that silver got as high as $50 in 2011 – and due to it having become overbought, it reacted back below it again. However, this was not in any way a negative development as it was simply a normal post-breakout reaction back to test support, and the foray of about $30 drained off some overhanging supply thus clearing the way for the next upleg to make more progress.
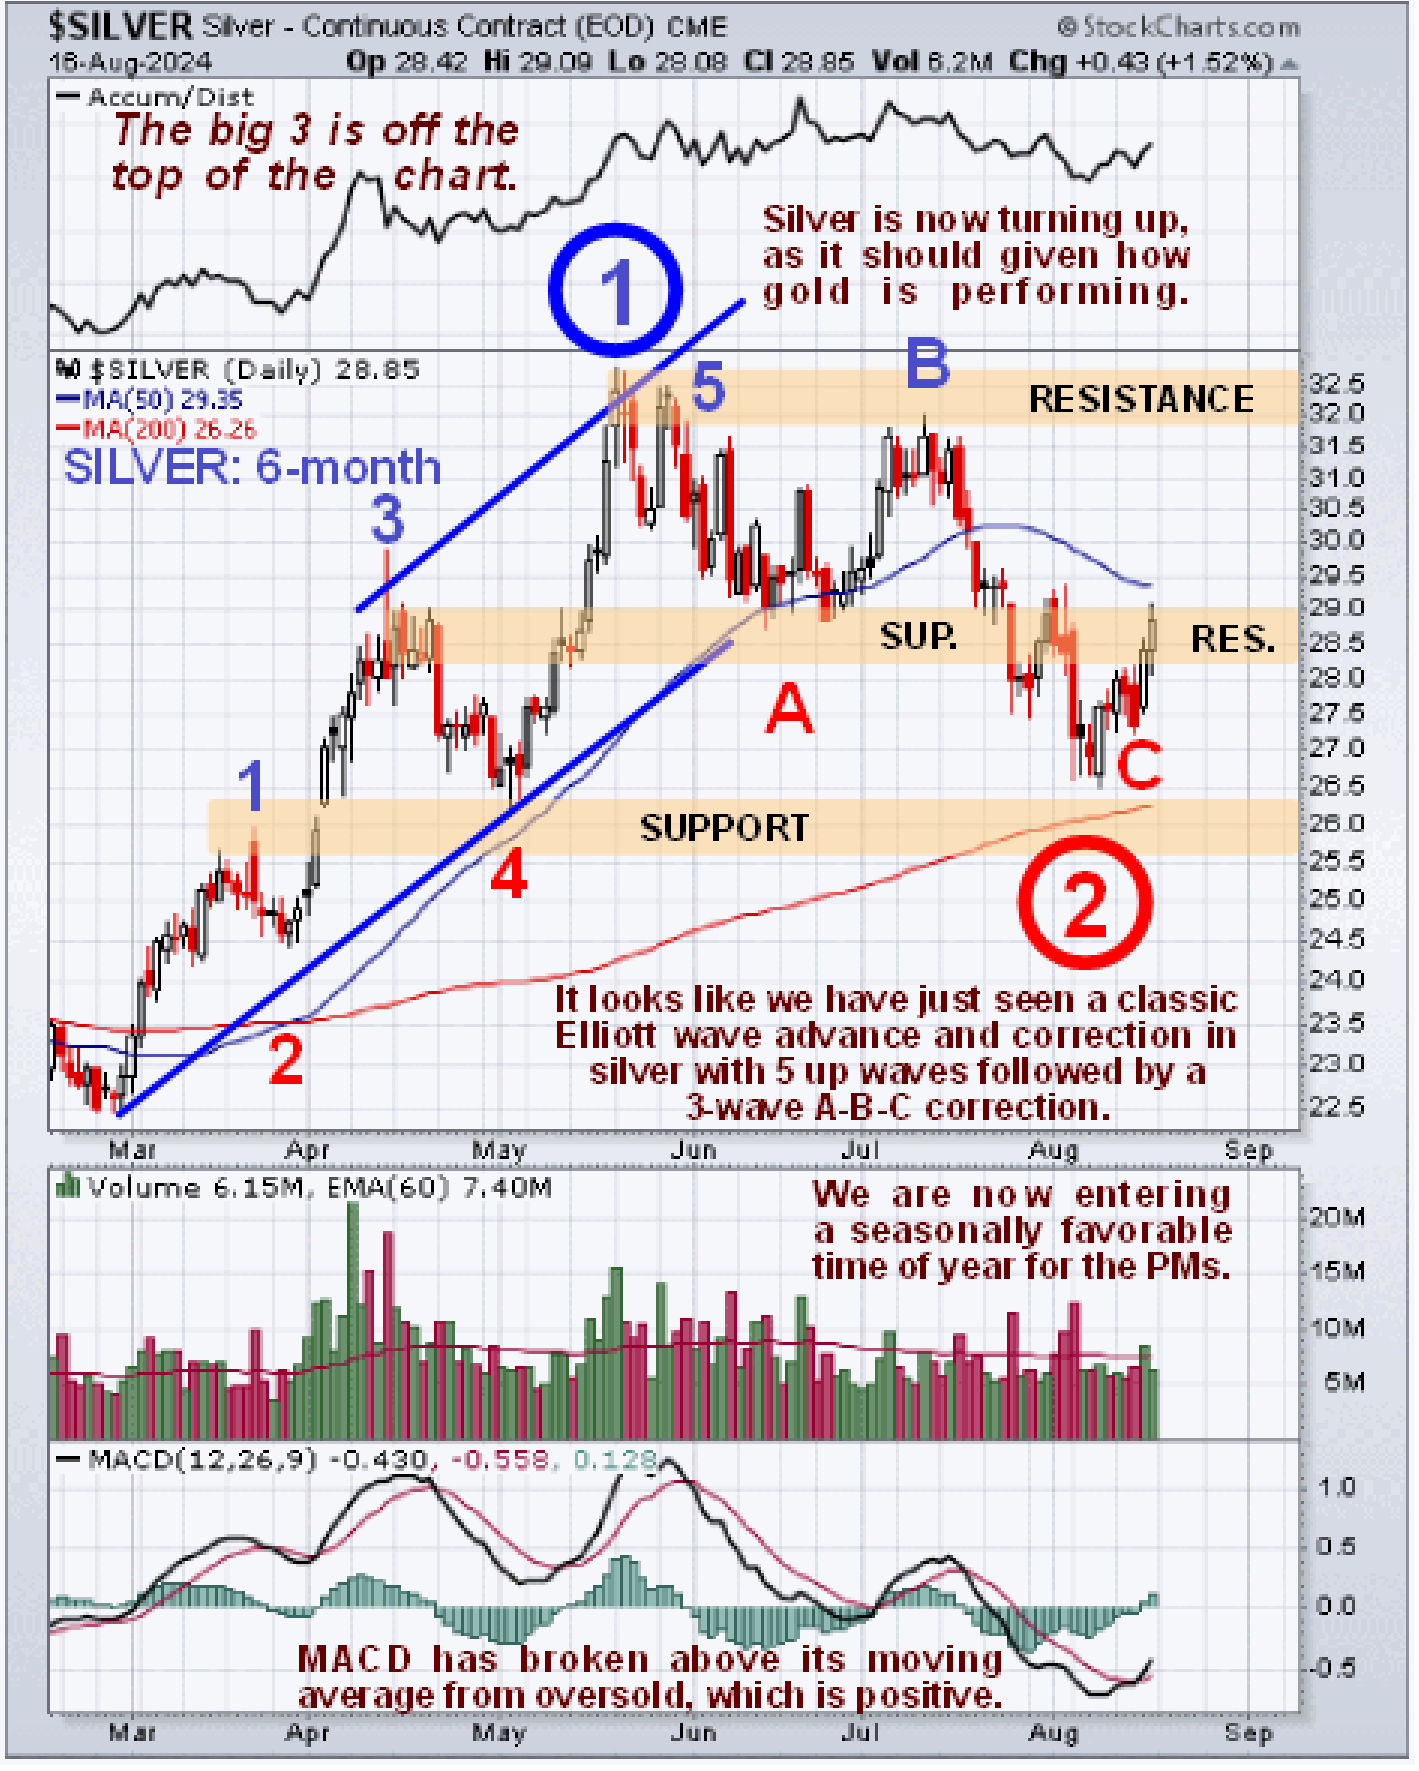
 Lastly, on its 6-month chart, we can see how silver is perfectly positioned for renewed advance following a normal correction back to support in the vicinity of its rising 200-day moving average. We don’t often attempt to employ Elliott Wave Theory because it can be complicated and tricky and has a tendency to work very well in retrospect but on this occasion, we see that silver has exhibited a near-perfect 5 waves up in the direction of the primary trend followed by a 3-wave correction which are believed to be waves 1 and 2 of a larger order uptrend. If so then big wave 3 is imminent which is likely to be substantial.

Shared by Golden State Mint on GoldenStateMint.com


