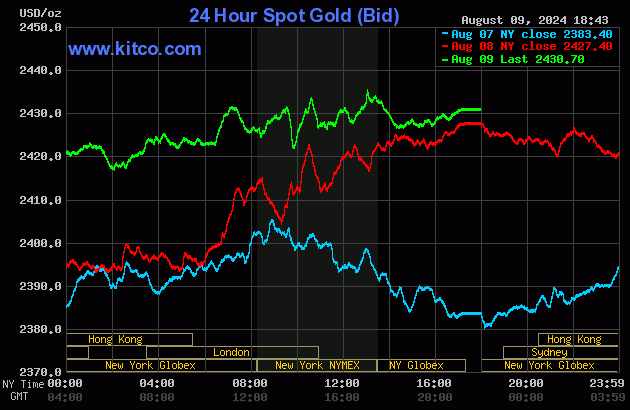
The gold price was sold quietly and a bit unevenly lower starting at the 6:00 p.m. EDT Globex open in New York on Thursday evening, with its low tick printed at 2 p.m. China Standard Time on their Friday afternoon. It began to head higher from there, but every serious-looking rally attempt after that was capped and turned lower by ‘da boyz’…with the last one coming about 1:05 p.m. in COMEX trading in New York.
The low and high ticks in gold were recorded by the CME Group as $2,433.90 and $2,453.40 in the October contract — and $2,456.10 and $2,476.50 in December. The August/October price spread differential in gold at the close in New York on Friday afternoon was $18.30…October/ December was $23.00… December/February was $21.90 — and February/April was $18.30 an ounce.
Gold was closed in New York on Friday afternoon at $2,430.70 spot, up $3.30 on the day. Net volume was on the lighter side at 160,000 contracts — and there were a bit under 5,000 contracts worth of roll-over/switch volume on top of that.
I saw that a hefty 611 gold, plus 2 silver contracts were traded in August yesterday — and we’ll find out later this evening how much of this shows up in the Daily Delivery and Preliminary Reports.
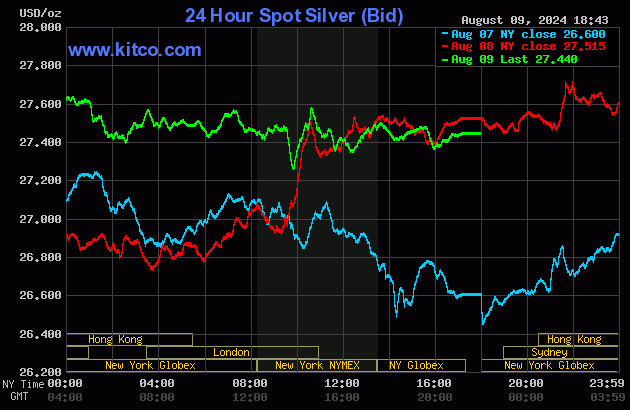
After chopping quietly sideways for the first three hours of Globex trading, the silver price jumped up a bit starting shortly after the 9:30 a.m. CST open in Shanghai on their Friday morning — and from that point it was sold/ engineered lower until shortly before 2 p.m. CST. From that juncture it wandered/chopped quietly sideways to a bit lower until the market closed at 5:00 p.m. EDT in New York on their Friday afternoon. Like for gold, every rally attempt no matter how tiny, met the same fate.
The high and low ticks in silver were recorded as $27.84 and $27.325 in the September contract. The September/December price spread differential in silver at the close in New York yesterday was 39.4 cents — and December/ March25 was 36.1 cents an ounce.
Silver was closed on Friday afternoon in New York at $27.44 spot, down 7.5 cents from Thursday. Net volume was very much on the quieter side at around 41,800 contracts — and there were a bit over 19,500 contracts worth of roll-over/switch volume out of September and into future months in this precious metal…mostly into December of course…but with a decent amount into March25 as well.
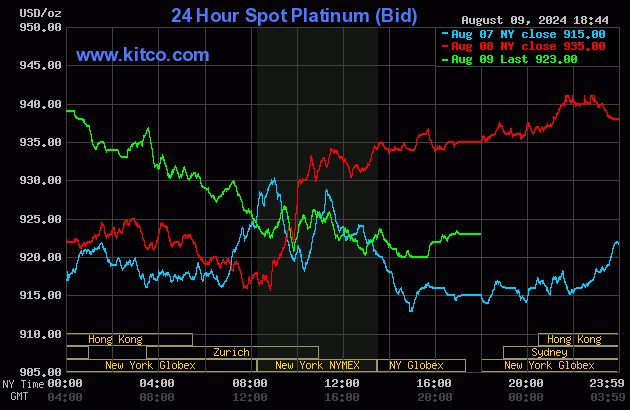
The platinum price edged a bit higher until around 9:40 a.m. China Standard Time on their Friday morning — and an hour and change later ‘da boyz’ appeared — and their efforts lasted until the 10 a.m. EDT afternoon gold fix in London. Its ensuing rally was over by the 11 a.m. EDT Zurich close — and it was sold lower anew until an hour before trading ended. Platinum was closed lower by 12 bucks at $923 spot.
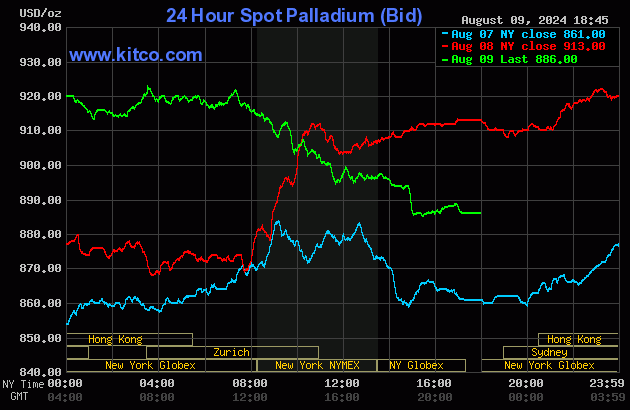
Palladium rallied a bit starting at the 9:00 a.m. open of Globex trading in Shanghai — and that lasted until around 11 a.m. CST. From there it wandered quietly sideways until it ran into ‘something’ shortly after the noon silver fix in London. ‘Da boyz’ then worked their magic until 3 p.m. in the very thinly-traded after-hours market in New York — and it didn’t do much after that. Palladium was closed at $886 spot, down 27 dollars on the day.
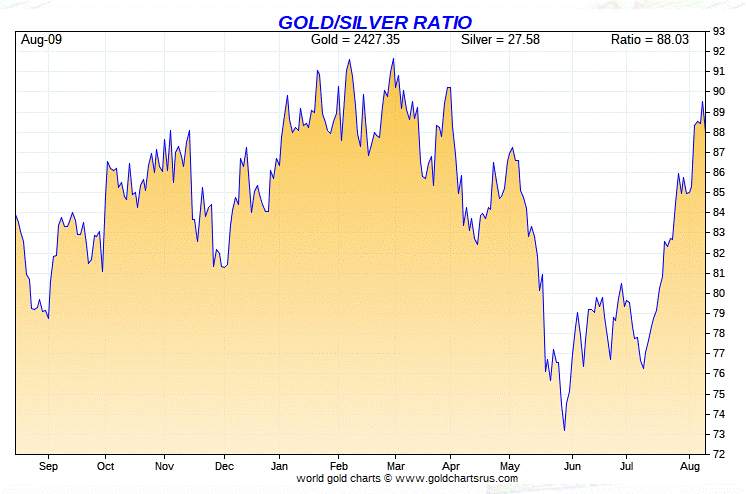
Based on the kitco.com spot closing prices in silver and gold posted above, the gold/silver ratio worked out to 88.6 to 1 on Friday…compared to 88.2 to 1 on Thursday.
Here’s the 1-year Gold/Silver Ratio Chart…courtesy of Nick Laird. Click to enlarge.
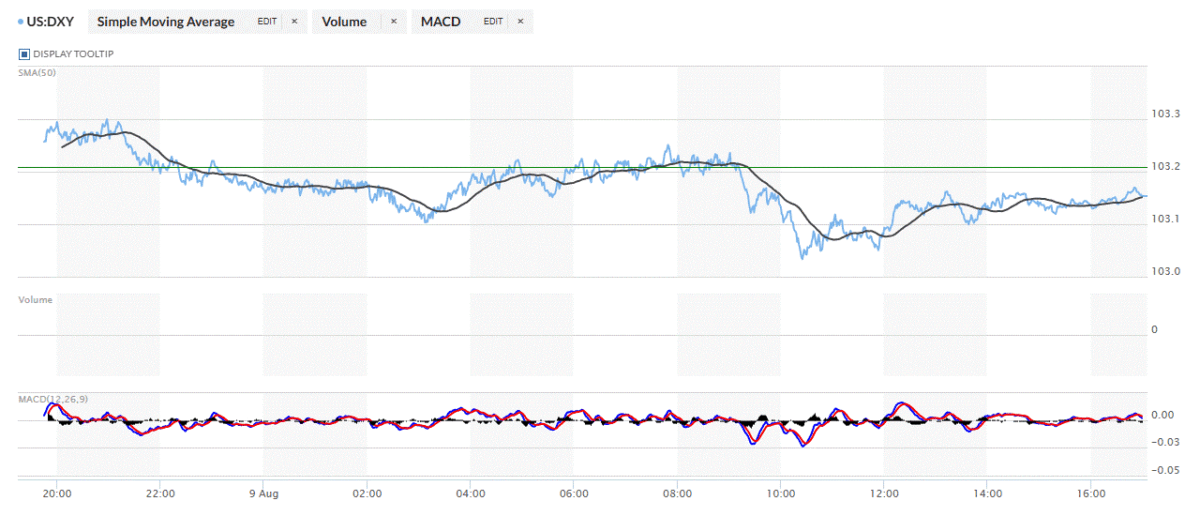
The dollar index closed very late on Thursday afternoon at 103.21 — and then opened higher by 5 basis points once trading commenced at 7:45 p.m. EDT on Thursday evening, which was 7:45 a.m. China Standard Time on their Friday morning. Then, after a brief tick higher, it traded mostly flat until it began to head lower at 9:12 a.m. CST. That quiet sell-off ended around 8:10 a.m. in London — and from there it crept higher at an ever-decreasing rate until around 9 a.m. in New York. It was sold two steps lower from that juncture until 10:25 a.m. — and then chopped a bit higher until around 12:20 p.m. EDT. It proceeded to wander quietly sideways until the market closed at 5:00 p.m.
The dollar index finished the Friday trading session at 103.14…down 7 basis points from its close on Thursday.
Here’s the DXY chart for Friday…thanks to marketwatch.com as usual. Click to enlarge.
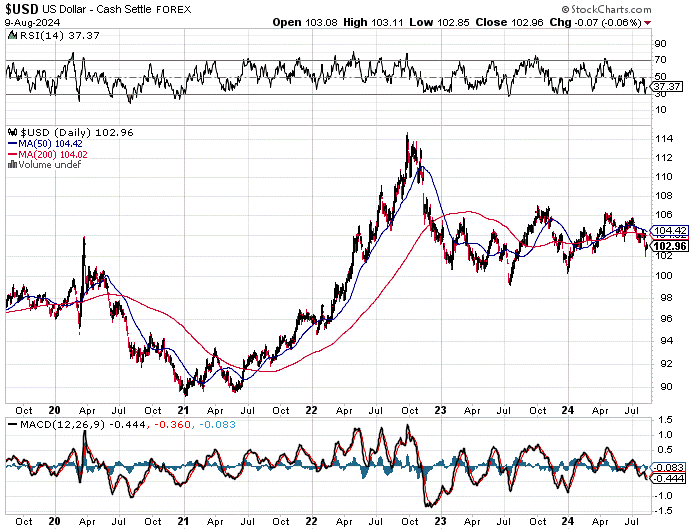
And here’s the 5-year U.S. dollar index chart that appears in this spot every Saturday column, courtesy of stockcharts.com as always. The delta between its close…102.99…and the close on the DXY chart above, was 22 basis points below its spot close. Click to enlarge.
Any attempt by the both silver and gold to react to that dollar swoon in early trading in New York, wasn’t allowed to be reflected in their respective prices.
U.S. 10-year Treasury: 3.9420%…down 0.0550/(-1.3760%)…as of the 1:59 p.m. EDT close
Here’s the 5-year 10-year U.S. Treasury chart from the yahoo.com Internet site — which puts the yield curve into a somewhat longer-term perspective. Click to enlarge.
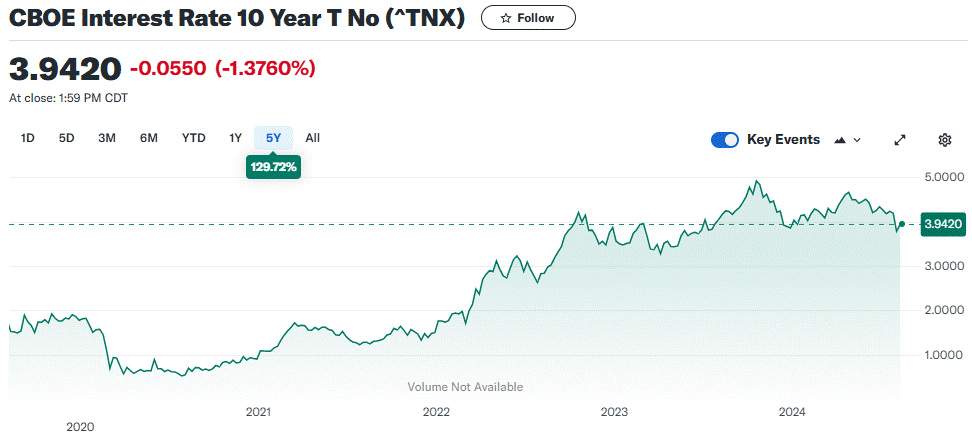
The ten-year closed the week higher by 27 basis points, but the Fed made sure that although it traded above 4.00% on Thursday, it wasn’t allowed to close with that handle. And as I continue to point out, the Fed has had the yield curve under lock-down since 19 October of last year.
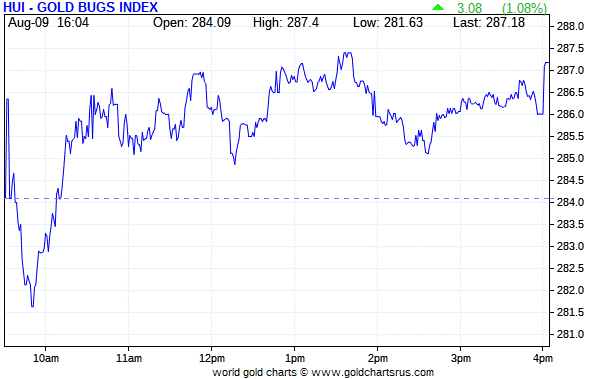
The gold shares headed lower almost right from the moment that trading began at 9:30 a.m. in New York on Friday morning — and their respective low ticks were set around 9:50 a.m. EDT. They then rallied rather sharply until around 10:55 a.m. — and from there they wandered/ chopped quietly sideways until the markets closed at 4:00 p.m. EDT. The HUI closed higher by 1.08 percent.
Here’s Nick’s 1-year Silver Sentiment Index chart, updated with Friday’s candle. It closed up 1.36 percent, despite the fact that silver was closed down on the day. Click to enlarge.
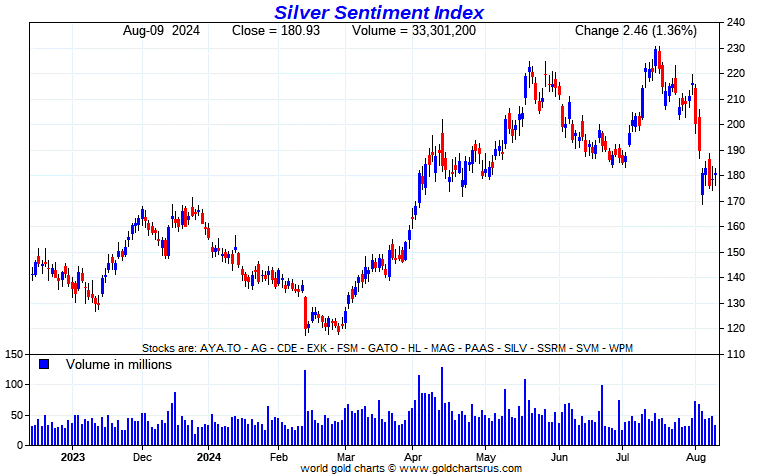
The star was Fortuna Silver, as it closed up 4.83 percent on its Q2/24 earnings report from a day or so ago — and the biggest underperformer was Endeavour Silver, as they closed lower by 1.60 percent.
I didn’t see any news yesterday on any of the silver companies that comprise the above Silver Sentiment Index.
The new short report came out yesterday — and it showed that the short position in First Majestic Silver rose by 8.37% to 16.97 million shares sold short on the NYSE…5.72% of the float.
The silver price premium in Shanghai over the U.S. price on Friday was 10.67 percent.
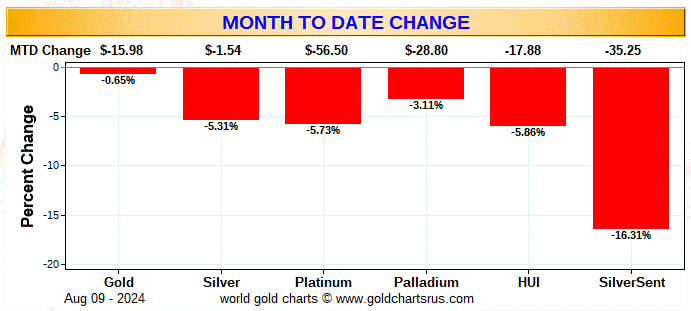
Here are the usual three charts that appear in this spot in every weekend missive. They show the changes in gold, silver, platinum and palladium in both percent and dollar and cents terms, as of their Friday closes in New York — along with the changes in the HUI and the new Silver Sentiment Index.
Here’s the weekly chart — and it’s no surprise that everything silver is getting brutalized on an absolute basis…but on a relative basis, it’s the other way around. Click to enlarge.

Here’s the month-to-date chart — and it’s wall-to-wall red — and what I said about gold and silver and their equities on the weekly chart, is the same on this chart…but that’s very cold comfort.
This one shows the year-to-date changes — and only platinum and hapless palladium remain down year-to-date…thanks to ‘da boyz’. Everything gold is outperforming everything silver. But as I said earlier, considering how badly ‘da boyz’ have leaned on silver relative to gold during the last month, the silver equities aren’t doing all that bad. Click to enlarge.
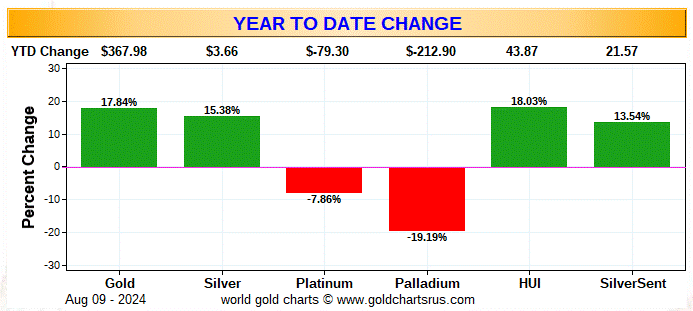
Of course — and as I mention in this spot every Saturday — and will continue to do so…is that if the silver price was sitting close to its all-time $50 high, like gold is currently close to its new all-time intraday high of this past Monday…it’s a given that the silver equities would be outperforming their golden cousins by an absolute country mile.
The CME Daily Delivery Report for Day 9 of August deliveries showed that only 5 gold — and 2 silver contracts were posted for delivery within the COMEX-approved depositories on Tuesday.
In gold, the only short/issuer that mattered was Goldman Sachs, issuing 4 contracts out of its client account. The two biggest long/stoppers were the same as they’ve been all month so far…JPMorgan and BMO [Bank of Montreal] Capital, picking up 3 and 2 contracts respectively. One of the contracts stopped by JPMorgan was for its house account.
In silver, the lone short/issuer was Advantage — and JPMorgan and ADM picked up 1 contract each for their client accounts.
In platinum, there were 2 contracts issued and stopped.
The link to yesterday’s Issuers and Stoppers Report is here.
Month-to-date there have been 17,181 gold contracts issued/reissued and stopped — and that number in silver is 702 contracts. In platinum it’s 94 contracts — and in palladium…2.
The CME Preliminary Report for the Friday trading session showed that gold open interest in August rose by 140 contracts, leaving 4,028 still around…minus the 5 contracts mentioned a few paragraphs ago. Thursday’s Daily Delivery Report showed that 57 gold contracts were actually posted for delivery on Monday, so that means that 140+57=197 more gold contracts just got added to the August delivery month.
I’m still wondering about those 4,000 gold contracts that remain open in August — and why the shorts…no more than one or two in total…are being so shy about coughing up the metal. As I said earlier this week, there’s absolutely no financial benefit to them for holding out.
Silver o.i. August declined by 17 contracts, leaving 113 still open, minus the 2 contracts mentioned a bunch of paragraphs ago. Thursday’s Daily Delivery Report showed that 18 silver contracts were actually posted for delivery on Monday, so that means that 18-17=1 more silver contract was added to August deliveries.
Total gold open interest rose by 4,600 COMEX contracts — and total silver o.i. rose by 205 contracts. Both these numbers are subject to some revisions by the time the CME gets around to posting the final figures on their Internet site later on Monday morning CDT.
I’ll resurrect Thursday’s open interest data one more time. In the Preliminary Report it showed an increase of 7,033 COMEX contracts, which was far less than I was expecting…but the final number was only 1,502 contracts…WTF? That amazing 936 contract Preliminary Report drop in silver o.i. turned into a decline of 1,243 COMEX contracts in the final number on the CME’s website…which is incredible considering silver closed higher by 92 cents on Thursday. I have more on this in The Wrap.
There were no reported changes in either GLD or SLV on Friday.
The new short report was posted on The Wall Street Journal‘s website very early on Friday evening EDT — and it showed that the short position in SLV dropped by 34.59%…from 20.90 million shares, down to 13.14 million shares. The short position in GLD also declined, it by 6.40%…from 11.32 million shares sold short, down to 10.59 million shares sold short.
This is the lowest short position in silver since mid March when it was 12.61 million troy ounces.
The short position in SLV remains too large by at least 5 million shares — and the short position in GLD is of no concern.
Considering the huge mountain of silver that was deposited into SLV during the two week reporting period that ended on Wednesday, July 31…I was expecting/hoping for a bigger number than that. But some of those short may be “short against the box” — and the deposit just hasn’t been reported yet. This is a devious technique that some shorts use — and that Ted had pointed out over the years.
The next short report is due out on Monday, August 26.
In other gold and silver ETFs and mutual funds on Planet Earth on Friday, net of any changes in COMEX, GLD and SLV inventories, there were a net 65,757 troy ounces of gold removed — and all because of the 90,669 troy ounces removed from Amundi/GOLD…an ETF that I’d not heard of before. A net 1,223,980 troy ounces of silver were removed as well — and all because of the 2,312,001 troy ounces pulled out of iShares/SVR.
There was no sales report from the U.S. Mint yesterday — and nothing month-to-date, either.
The only activity in gold over at the COMEX-approved depositories on the U.S. east coast on Thursday were the 5,112.009 troy ounces/159 kilobars that left Brink’s, Inc. There was no paper activity — and the link to this is here.
There was very hefty activity in silver, as one truckload/606,833 troy ounces arrived at Asahi — and two truckloads/1,216,718 troy ounces were shipped out.
The first [big] truckload…634,135 troy ounces…left Brink’s, Inc. — and the second/582,582 troy ounces departed Delaware.
There was also some paper activity, as one truckload/600,659 troy ounces were transferred from the Registered category and back into Eligible over at Brink’s, Inc.
The link to Thursday considerable COMEX action in silver, is here.
It was also pretty busy over at the COMEX-approved gold kilobar depositories in Hong Kong on their Thursday, with all of the activity happening at Brink’s, Inc. as usual. They reported receiving 510 of them — and shipped out 1,997 kilobars. The link to this, in troy ounces, is here.
The Shanghai Futures Exchange reported that a net 593,218 troy ounces/one truckload of silver was removed from their inventories on Friday, which now stands at 30.002 million troy ounces.
Türkiye updated their website with July’s gold and silver import numbers — and it showed that they imported 6.193 tonnes/199,110 troy ounces of gold that month…plus 47.940 tonnes/1,541,324 troy ounces of silver.
Here are the usual 20-year charts that show up in this space in every weekend column. They show the total amounts of physical gold and silver held in all know depositories, ETFs and mutual funds as of the close of business on Friday.
During the week just past, there were a net 149,000 troy ounces of gold removed. But a net 2.177 million troy ounces of silver were added. Click to enlarge.
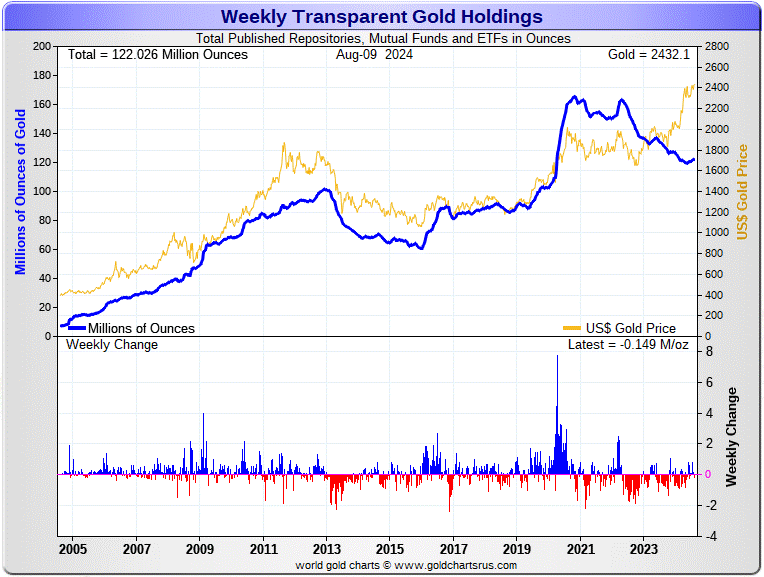
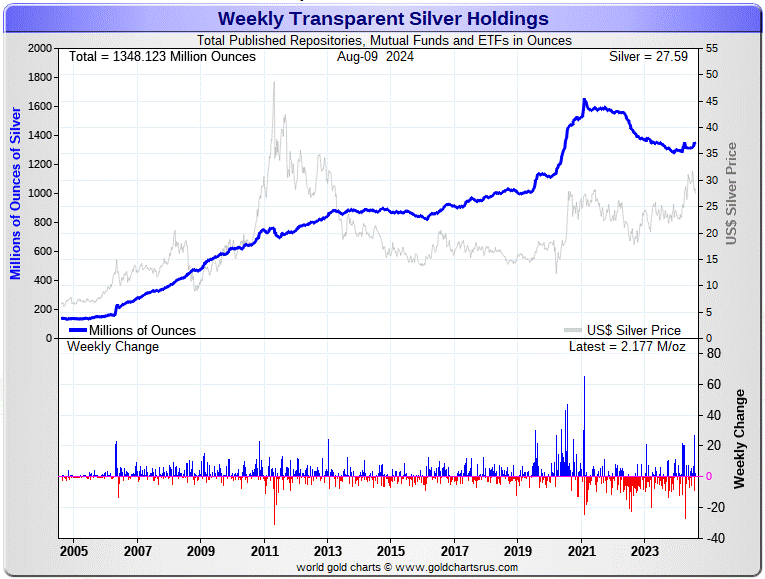
According to Nick Laird’s data on his website, there were a net 518,700 troy ounces of gold added — plus a net 26.556 million troy ounces of silver were added to all the world’s known depositories, mutual funds and ETFs during the last four weeks.
Retail bullion sales are still exceedingly slow…and one has to wonder about those 1.7 million silver eagles that the mint reported selling at the end of July. Who bought those? Premiums vary. They’re very high at Kitco…but somewhat to much lower in most other places.
Then there’s the huge quantities of silver that will be required by all the silver ETFs and mutual funds once institutional buying finally kicks in….which has been obvious in SLV, plus other ETFs this past month.
And as Ted stated a while ago now, it would appear that JPMorgan has parted with well over 500 million troy ounces of the at least one billion troy ounces that they’d accumulated since the drive-by shooting that commenced at the Globex open at 6:00 p.m. EDT on April 30, 2011.
If they continue in this vein, they are going to have to continue to cough up even more ounces to feed this year’s deficit…another 215 million of them according to that latest report from The Silver Institute…which I’m sure didn’t include the approximately 120 million ounces that India purchased earlier in the year…plus most of the 13.9 million ounces that China imported in June…plus what into SLV and other silver ETFs over the last month.
The physical demand in silver at the wholesale level continues unabated — and that was on full display yet again this week…as frantic deposits and withdrawals continued at the COMEX, SLV — and other ETFs and mutual funds. The amount of silver being physically moved, withdrawn, or changing ownership seems to be hitting new heights with each passing week — and that trend has continued without respite this past week as well. This manic in/out activity, as Ted had been pointing out for years, is a sure sign that 1,000 oz. good delivery bars are becoming ever harder to come by.
New silver has to be brought in from other sources [JPMorgan] to meet the ongoing demand for physical metal. This will continue until available supplies are depleted…which will be the moment that JPMorgan & Friends stop providing silver to feed this deepening structural deficit, now in its fourth year.
The vast majority of precious metals being held in these depositories are by those who won’t be selling until the silver price is many multiples of what it is today.
Sprott’s PSLV is the third largest depository of silver on Planet Earth with 174.0 million troy ounces — and some distance behind the COMEX, where there are 302.4 million troy ounces being held…minus the 103 million troy ounces mentioned in the next paragraph.
It’s now been proven beyond a shadow of a doubt that 103 million troy ounces of that amount in the COMEX is actually held in trust for SLV by JPMorgan according to a letter Ted received from the CFTC earlier this year. That brings JPMorgan’s actual silver warehouse stocks down to around the 31.8 million troy ounce mark…quite a bit different than the 134.77 million they indicate they have — and precisely unchanged from what they showed last Friday.
But PSLV is still some distance behind SLV, as they are the largest silver depository, with 465.7 million troy ounces as of Friday’s close…up 6.8 million troy ounces from a week ago.
The latest short report from yesterday, showed that the short position in SLV fell by a hefty 34.59 percent…from 20.09 million shares sold short in the prior short report…down to 13.14 million shares in the current report.
BlackRock issued a warning several years ago to all those short SLV, that there might come a time when there wouldn’t be enough metal for them to cover. That would only be true if JPMorgan decides not to supply it to whatever entity requires it…which is most certainly a U.S. bullion bank, or perhaps more than one.
The next short report will be posted on The Wall Street Journal‘s website very early on Monday evening EDT on August 26.
Then there’s that other little matter of the 1-billion ounce short position in silver held by Bank of America in the OTC market…with JPMorgan & Friends on the long side. Ted said it hadn’t gone away — and he’d also come to the conclusion that they’re short around 25 million ounces of gold with these same parties as well. The latest report for the end of Q1/2024 from the OCC came out about three weeks ago — and after carefully scrutiny, I noted that nothing much had changed since the end of Q4/2023.
The Commitment of Traders Report, for positions held at the close of COMEX trading on Tuesday, showed the expected declines in the commercial net short positions in both silver and gold…but weren’t anywhere near as impressive as I expected…especially in gold, which had a rather spectacular surprise under the hood. I’ll get into that in a bit.
In silver, the Commercial net short position declined by an unspectacular and irrelevant 739 COMEX contracts…3.695 million troy ounces of the stuff.
They arrived at that number by increasing their long position by 601 contracts — and also reduced their short position by 138 contracts. It’s the sum of those two numbers that represents their change for the reporting week.
Under the hood in the Disaggregated COT there weren’t big changes, which is no surprise. The Managed Money traders increased their net long position by a scant 169 COMEX contracts…which they arrived at by reducing their long position by 1,361 contracts — and reduced their short position by 1,530 contracts. It’s the difference between those two numbers that represents their change for the reporting week.
The Other Reportables reduced their net long position by 149 COMEX contracts — while the Nonreportable/small traders reduced their net long position by 759 contracts.
Doing the math: 759 plus 149 minus 169 equals 739 COMEX contracts…the change in the Commercial net short position.
The Commercial net short position in silver now stands at 69,631 contracts/348.155 million troy ounces of silver…down those 739 contracts from the 70,370 contracts/351.850 million troy ounces they were short in the August 2 COT Report.
The Big 4 shorts decreased their net short position by 1,058 contracts, down to 51,490 contracts during the reporting week…from the 52,548 contracts they were short in last Friday’s COT Report…which is still hugely bearish.
The Big ‘5 through 8’ shorts actually increased their net short position, them by 906 contracts…from the 22,110 contracts in last Friday’s COT Report, up to 23,016 contracts in yesterday’s COT Report. This is about 10,000 contracts more than they ‘normally’ hold short.
The Big 8 commercial shorts in total decreased their overall net short position from 74,658 contracts, down to 74,506 COMEX contracts week-over-week…a decrease of an insignificant 152 COMEX contracts…the difference between the above two numbers, which is still very bearish.
Making up the difference between the change in the commercial net short position…739 contracts — and what the Big 8 traders did…152 contracts… Ted’s raptors, the small commercial traders other than the Big 8, were buyers for the fourth week in a row…increasing their long position by 739-152=587 COMEX contracts — and are now net long silver 4,875 contracts.
Please don’t forget that the collusive commercial traders can only buy what they can trick/engineer the Managed Money traders et al. into selling. Even then its a fight between the Big 4, the Big ‘5 through 8’ — and Ted’s raptors for the spoils of these engineered price declines. That was the case again this week.
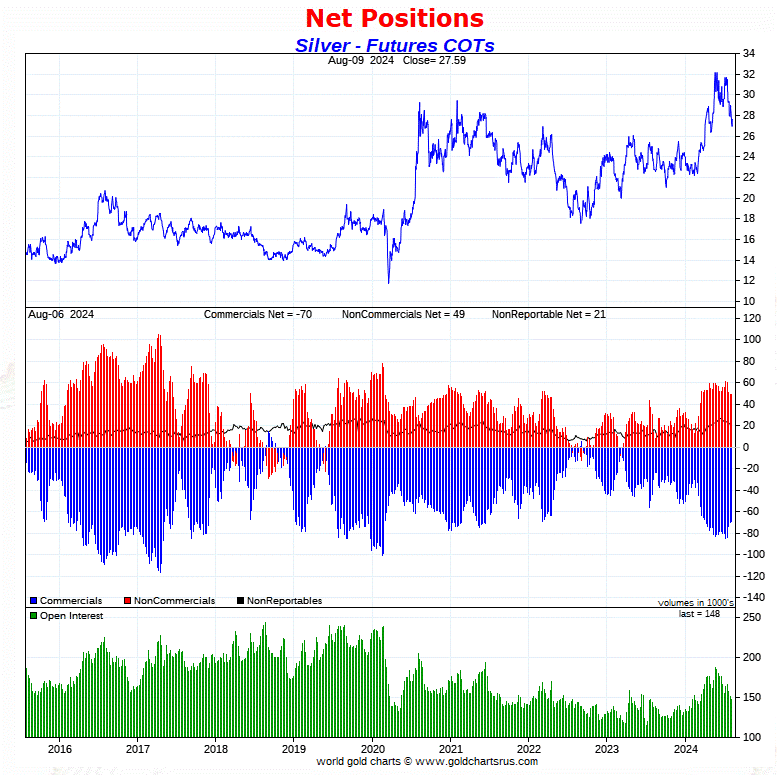
The price action in silver during the reporting week certainly indicated that there was going to be a fairly decent decline in the Commercial net short position in silver, but that didn’t happen. As for why it didn’t…I have no idea.
The Big 8 collusive commercial shorts in silver, minus their uneconomic and market-neutral spread trades, are still short a bit over 55% of the entire open interest in silver in the COMEX futures market — and what they do is all that matters.
So, from a COMEX futures market perspective, the set-up is still very bearish in silver…but as Ted mentioned on several occasions over the years, at some point what the numbers show in the COT Report won’t matter, as the drumbeat of that structural supply/demand deficit grows ever louder. The manic in/out movement in silver in the COMEX, SLV and other ETFs and mutual funds, is the ongoing proof of that.
In gold, the commercial net short position fell by 3,823 contracts, or 382,300 troy ounces of the stuff. I was hoping for a number many, many multiples of that — and the reason it wasn’t was a shocker, as you’ll soon see.
The commercial traders arrived at that number by reducing their long position by a surprising and hefty 10,573 COMEX contracts — and also reduced their short position by 14,396 contracts. It’s the difference between those two numbers that represented their change for the reporting week.
Under the hood in the Disaggregated COT Report, the Managed Money traders didn’t do much, as they decreased their long position by 1,578 COMEX contracts…accomplished by selling 5,283 long contracts — and reducing their short position by 3,705 contracts as well.
The Other Reportables were also sellers, reducing their net long position by 6,274 contracts…while the Nonreportable/small traders were surprising buyers, increasing their net long position by 4,029 COMEX contracts.
Doing the math: 1,578 plus 6,274 minus 4,029 equals 3,823 COMEX contracts, the change in the commercial net short position.
The commercial net short position in gold now sits at 269,034 contracts/26.903 million troy ounces of the stuff…down those 3,823 contracts from the 272,856 contracts/27.286 million troy ounces they were short in the August 2 COT Report.
But here comes the shocker…which even took me by surprise.
The Big 4 shorts actually increased their net short position by 13,343 COMEX contracts…from 188,527 contracts, up to 201,870 contracts. I don’t remember the last time that the Big 4 were short north of 200,000 contracts in gold…but I was a lot younger than I am now the last time it happened.
The Big ‘5 through 8’ shorts decreased their net short position, them by 5,229 contracts…from the 72,039 contracts they held short in last Friday’s COT Report, down to 66,810 contracts held short in the current COT Report — and still a bearish short position for them as well…but much reduced from the 79,550 contracts they were short just three weeks ago.
The Big 8 short position increased from 260,566 contracts/26.057 million troy ounces, up to 268,680 contracts/26.868 million troy ounces…an increase of 8,114 COMEX contracts.
It was Ted’s raptors…the small commercial traders other than the Big 8…that were the most aggressive buyers for the second week in a row, as they reduced their eye-watering short position from 12,291 COMEX contracts, down to a piddling 354 contracts…as they bought back 11,937 short contracts during the reporting week just past. I’ll have more on this below the chart.
Here’s Nick Laird’s 9-year COT Report chart for gold…updated with the above data. Click to enlarge.
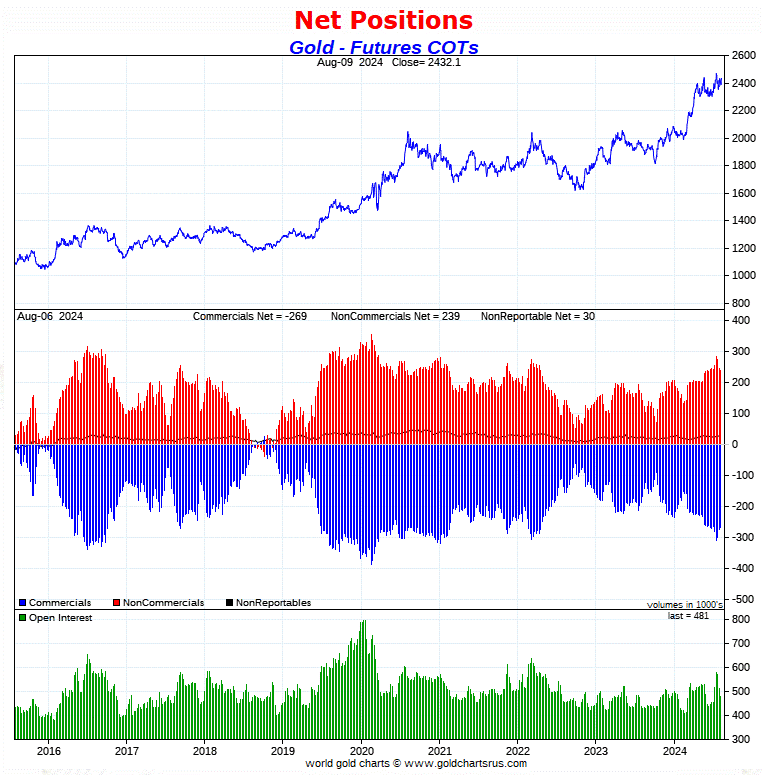
Over the last three reporting weeks Ted’s raptors…the small and equally collusive commercial traders other than the ‘Big 8’…have reduced their short position from 38,509 COMEX contracts, down to just 354 contracts as of yesterday’s COT Report.
Their short covering was so aggressive during this past reporting week that it forced one or more members of the ‘Big 4’ shorts to add to their short positions, because if they hadn’t, the gold price would have blown sky high.
The ‘Big 4’ also had to contend with the Big ‘5 through 8’ shorts…as they bought back 5,229 short contracts. The Big ‘5 through 8’ have also been aggressive buyers over the last two week as well…buying back 12,740 short contracts over that time period.
So it was a food fight in the commercial category…as the raptors and the Big ‘5 through 8’ shorts zoomed the ‘Big 4’ shorts.
As of this COT Report, the collusive ‘Big 8’ are short somewhere between 60 and 65% of the entire open interest in gold in the COMEX futures market… once their market-neutral spread trades are subtracted out…as the raptors are now market neutral. How’s that for a concentrated short position?
There’s still no sign that the Big 4 commercial shorts…all bullion banks and investment houses…are loosening their iron grip on the precious metals…au contraire. But the rest of the commercial shorts are running for the exits.
In the other metals, the Managed Money traders in palladium increased their net short position by a further 477 COMEX contracts — and are net short a record 16,283 contracts…52.7 percent of total open interest. And also, not surprisingly, all of the other four categories in the Disaggregated COT Report are net long palladium…the Swap Dealers in the commercial category in particular.
In platinum, the Managed Money traders decreased their net long position by 3,776 contracts during the reporting week — and are now back on the short side by 562 COMEX contracts. The traders in the Producer/Merchant category are mega net short 24,031 COMEX contracts…and the Swap Dealers in the commercial category are now net long 8,106 COMEX contracts. The traders in both the Other Reportables and Nonreportable/small traders categories are net long platinum by very decent amounts as well…the Other Reportables in particular.
It’s the world’s banks in the Producer/Merchant category that are ‘The Big Shorts’ in platinum, as stated in yesterday’s Bank Participation Report…which I’ll get into in a bit.
In copper, the Managed Money traders decreased their net long position by a further 3,269 COMEX contracts — but remain net long copper by 6,936 COMEX contracts…about 173 million pounds of the stuff as of yesterday’s COT Report…down from the 255 million pounds they were net long copper in last Friday’s report.
Copper, like platinum, continues to be a wildly bifurcated market in the commercial category. The Producer/Merchant category is net short 43,209 copper contracts/1.080 Billion pounds — while the Swap Dealers are net long 14,928 COMEX contracts/373 million pounds of the stuff.
Whether this means anything or not, will only be known in the fullness of time. Ted said it didn’t mean anything as far as he was concerned, as they’re all commercial traders in the commercial category. However, this bifurcation has been in place for as many years as I can remember — and that’s a lot.
In this vital industrial commodity, the world’s banks…both U.S. and foreign… are net long 8.4 percent of the total open interest in copper in the COMEX futures market as shown in the August Bank Participation Report that came out on Friday…down from the 11.8 percent they were net long in July’s. I thought for sure that they would have increased their net long position in copper in this report, but they didn’t.
At the moment it’s the commodity trading houses such as Glencore and Trafigura et al., along with some hedge funds, that are net short copper in the Producer/Merchant category, as the Swap Dealers are net long, as pointed out above.
The next Bank Participation Report is due out on Friday, September 6.
Here’s Nick Laird’s “Days to Cover” chart, updated with the COT data for positions held at the close of COMEX trading on Tuesday, August 6. It shows the days of world production that it would take to cover the short positions of the Big 4 — and Big ‘5 through 8’ traders in every physically traded commodity on the COMEX. Click to enlarge.
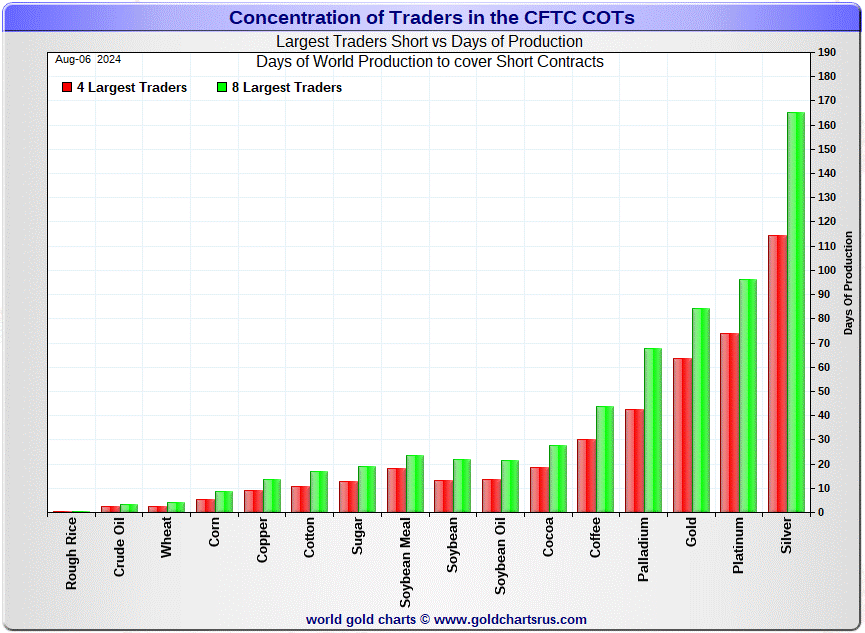
In this week’s data, the Big 4 traders are short about 114 days of world silver production… down about 3 days from the last COT report. The ‘5 through 8’ large traders are short an additional 51 days of world silver production…up about 2 days from last Friday’s COT Report, for a total of about 165 days that the Big 8 are short — and down 1 day from last week.
Those 165 days that the Big 8 traders are short, represents 5.5 months of world silver production, or 372.53 million troy ounces/74,506 COMEX contracts of paper silver held short by these eight commercial traders. Several of the largest of these are now non-banking entities, as per Ted’s discovery a year or so ago. August’s Bank Participation Report that came out yesterday, continues to confirm that this is still the case — and not just in silver, either.
The small commercial traders other than the Big 8 shorts, Ted’s raptors, are now net long silver by 4,875 COMEX contracts…as they increased their long position by 587 contracts during the past reporting week.
In gold, the Big 4 are short about 63 days of world gold production…up about 4 days from last Friday’s COT Report. The ‘5 through 8’ are short an additional 21 days of world production, down about 2 days from last week…for a total of 84 days of world gold production held short by the Big 8 — and up 2 days from the prior COT Report.
Besides the grotesque situation in silver in the above chart, I’ll point out just how short the Big 4 traders are in both platinum and gold…relative to the short position the Big 8 shorts in total…75% in gold — and 77% in platinum. Simply outrageous. How’s that for a concentrated short position?
The Big 8 commercial traders are short 50.5 percent of the entire open interest in silver in the COMEX futures market as of yesterday’s COT Report, up a bit from the 49.3 percent that they were short in last Friday’s COT Report — and a bit over the 55 percent mark once their market-neutral spread trades are subtracted out.
Spread trades are not reported in the Producer/Merchant category by the CFTC — and the reason as Ted has said was very simple. If one knew how many spread trades they had on, then you could calculate, to the contract, exactly how short they were in every COMEX commodity that they trade in — and those numbers are closely guarded secrets by both the CFTC and the CME Group.
In gold, it’s 55.9 percent of the total COMEX open interest that the Big 8 are short, up big from the 51.0 percent they were short in last Friday’s COT Report — and something over the 60 percent mark once their market-neutral spread trades are subtracted out.
The reason for that increase was because of the 30,269 decrease in gold’s total open interest during the reporting week, as the rest of those uneconomic and market-neutral spread trades put on earlier in July, were closed out during this past reporting week. But a big chunk of that decrease [about half] was also delivery related at the start of the August delivery month. A change of that size in open interest obviously affects the above percentage calculation of the Big 8 short position.
Ted was of the opinion that Bank of America is short about one billion ounces of silver in the OTC market, courtesy of JPMorgan & Friends. He was also of the opinion that they’re short 25 million ounces of gold as well. And with the latest report from the OCC in hand, I see that their position remains mostly unchanged…maybe down a bit, but nothing material.
The short position in SLV now sits at 13.14 million shares as of yesterday’s short report…down 34.59 percent from the 20.09 million shares sold short in the prior report. The next short report is due out on Monday, August 26.
The situation regarding the Big 4/8 commercial short position in gold and silver remains obscene and grotesquely bearish. It didn’t change in silver this past reporting week…and got worse in gold.
As Ted had been pointing out ad nauseam, the resolution of the Big 4/8 short positions will be the sole determinant of precious metal prices going forward — and not a thing has changed over the years in that regard.
The August Bank Participation Report [BPR] data is extracted directly from yesterday’s Commitment of Traders Report data. It shows the number of futures contracts, both long and short, that are held by all the U.S. and non-U.S. banks as of last Tuesday’s cut-off in all COMEX-traded products.
For this one day a month we get to see what the world’s banks have been up to in the precious metals. They’re usually up to quite a bit — and they certainly were again this past month.
[The August Bank Participation Report covers the five-week time period from July 2 to August 6 inclusive]
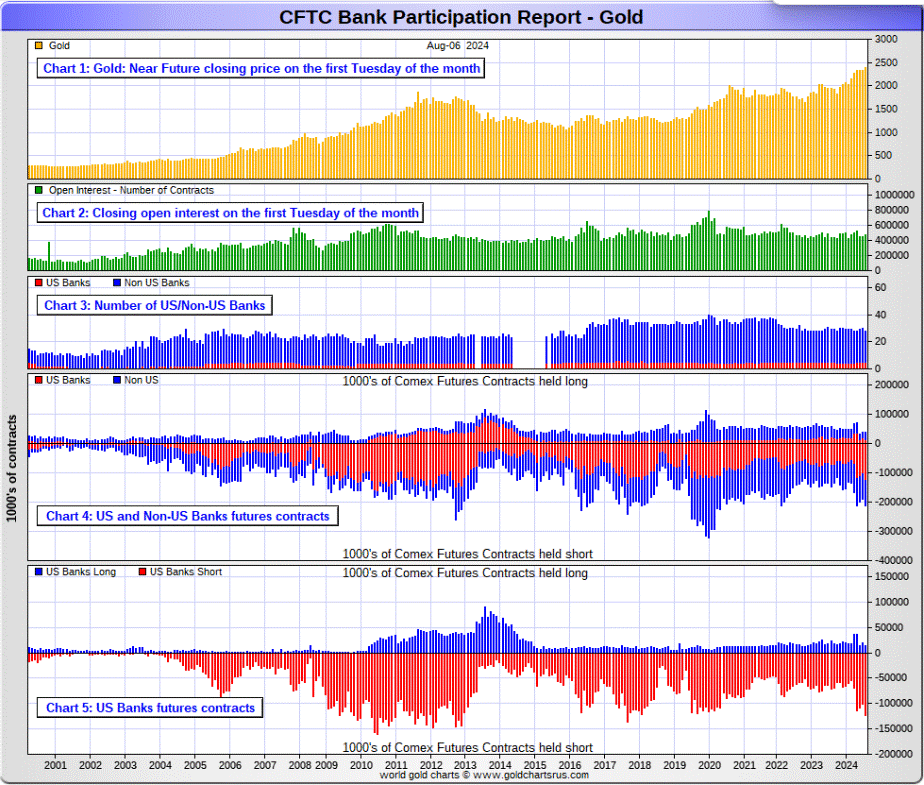
In gold, 5 U.S. banks are net short 108,825 COMEX contracts, up 26,900 contracts from the 81,925 contracts that these same 5 U.S. banks were short in July’s BPR. This is still the largest short position that the U.S. banks have held since January of 2020. It’s obscene.
Also in gold, 23 non-U.S. banks are net short 66,863 COMEX contracts, down 2,606 contracts from the 69,469 contracts that 25 non-U.S. banks were short in July’s BPR. This is the second month in a row that the non-U.S. banks have reduced their short position.
At the low back in the August 2018 BPR…these same non-U.S. banks held a net short position in gold of only 1,960 contacts — so they’ve been back on the short side in an enormous way ever since.
Although some of the largest U.S. and foreign bullion banks are in the Big 8 short category in gold, some of the hedge fund/commodity trading houses are short even more grotesque amounts of gold than the banks in that category. It’s also a strong possibility that the BIS could be short gold in the COMEX futures market as well.
As of August’s Bank Participation Report, 28 banks [both U.S. and foreign] are net short 36.6 percent of the entire open interest in gold in the COMEX futures market…up from the 33.3 percent that 30 banks were net short in the July BPR.
Here’s Nick’s BPR chart for gold going back to 2000. Charts #4 and #5 are the key ones here. Note the blow-out in the short positions of the non-U.S. banks [the blue bars in chart #4] when Scotiabank’s COMEX short position was outed by the CFTC in October of 2012. Click to enlarge.
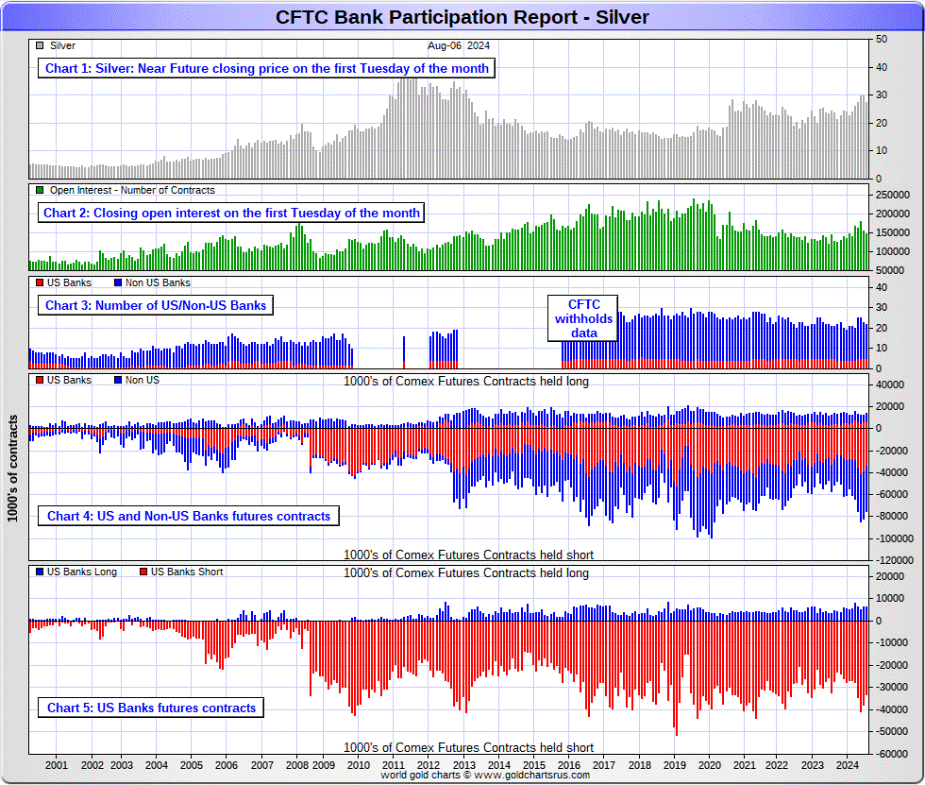
In silver, 5 U.S. banks are net short 26,904 COMEX contracts, down 4,627 contracts from the 31,531 contracts that these same 5 U.S. banks were short in the July BPR.
The biggest short holders in silver of the five U.S. banks in total, would be Citigroup, Wells Fargo, Bank of America — and maybe JPMorgan from time to time.
Also in silver, 17 non-U.S. banks are net short 34,263 COMEX contracts, down 3,883 contracts from the 38,146 contracts that 18 non-U.S. banks were short in the July BPR…their third largest short position since March 2020….when they were short 42,666 COMEX contracts.
I would suspect that HSBC, Barclays and Standard Chartered hold by far the lion’s share of the short position of these non-U.S. banks…as do some of Canada’s banks as well perhaps. And, like in gold, the BIS could also be actively shorting silver. The remaining short positions divided up between the other 12 or so non-U.S. banks are immaterial — and have always been so. The same can be said of most of the 23 non-U.S. banks in gold.
As of August’s Bank Participation Report, 22 banks [both U.S. and foreign] are net short 41.4 percent of the entire open interest in the COMEX futures market in silver — down from the 45.0 percent that 23 banks were net short in the July BPR.
Here’s the BPR chart for silver. Note in Chart #4 the blow-out in the non-U.S. bank short position [blue bars] in October of 2012 when Scotiabank was brought in from the cold. Also note August 2008 when JPMorgan took over the silver short position of Bear Stearns—the red bars. It’s very noticeable in Chart #4—and really stands out like the proverbial sore thumb it is in chart #5.
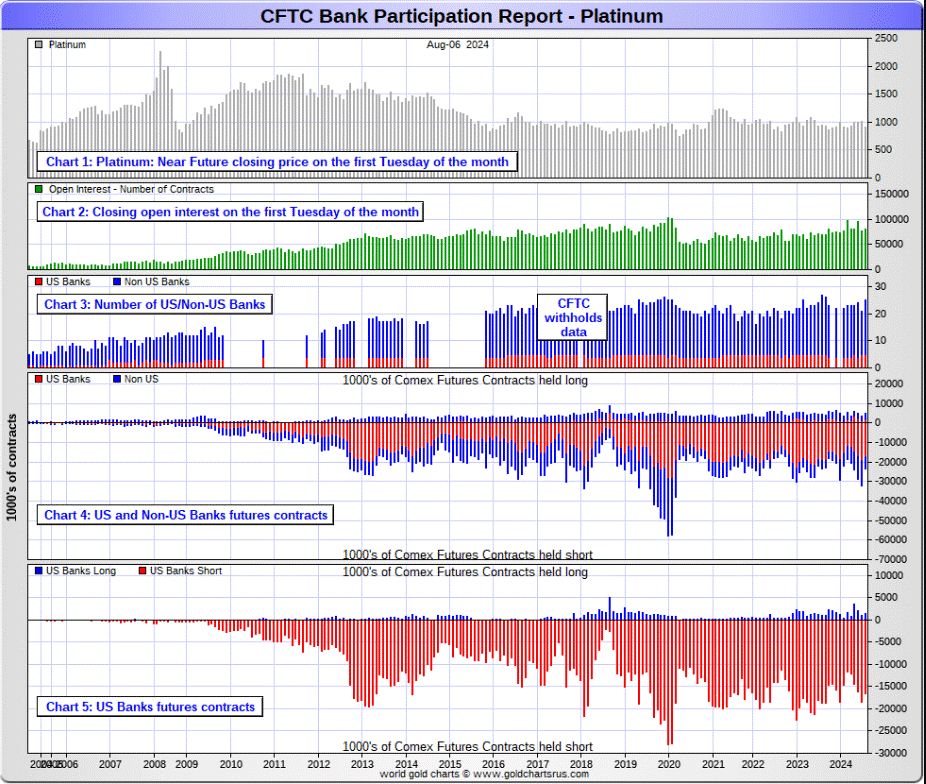
In platinum, 5 U.S. banks are net short 15,142 COMEX contracts in the August BPR, down 2,257 contracts from the 17,399 contracts that these same 5 U.S. banks were short in the July BPR.
At the ‘low’ back in September of 2018, these U.S. banks were actually net long the platinum market by 2,573 contracts. So they have a very long way to go just to get back to market neutral in platinum…if they ever intend to, that is. They look permanently stuck on the short side to me, a fact that I point out regularly.
Also in platinum, 20 non-U.S. banks dropped their net short position by a whopping 7,731 contracts…down to 3,576 contracts, from the 11,307 contracts that 16 non-U.S. banks were net short in the July BPR.
Back in the December 2023 BPR, these non-U.S. banks were net short a microscopic 35 platinum contracts…so they’re back to heading in the right direction — and in an obvious hurry to get there.
Platinum remains the big commercial shorts No. 2 problem child after silver… but a very distant No. 2 down the list. How it will ultimately be resolved is unknown, but most likely in a paper short squeeze, as the known stocks of platinum are minuscule compared to the size of the short positions held — and that’s just the short positions of the world’s banks I’m talking about here.
Of course there’s now a structural deficit in it [and palladium] as well.
And as of August’s Bank Participation Report, 25 banks [both U.S. and foreign] were net short 23.1 percent of platinum’s total open interest in the COMEX futures market, down big from the 37.5 percent that 20 banks were net short in July’s BPR.
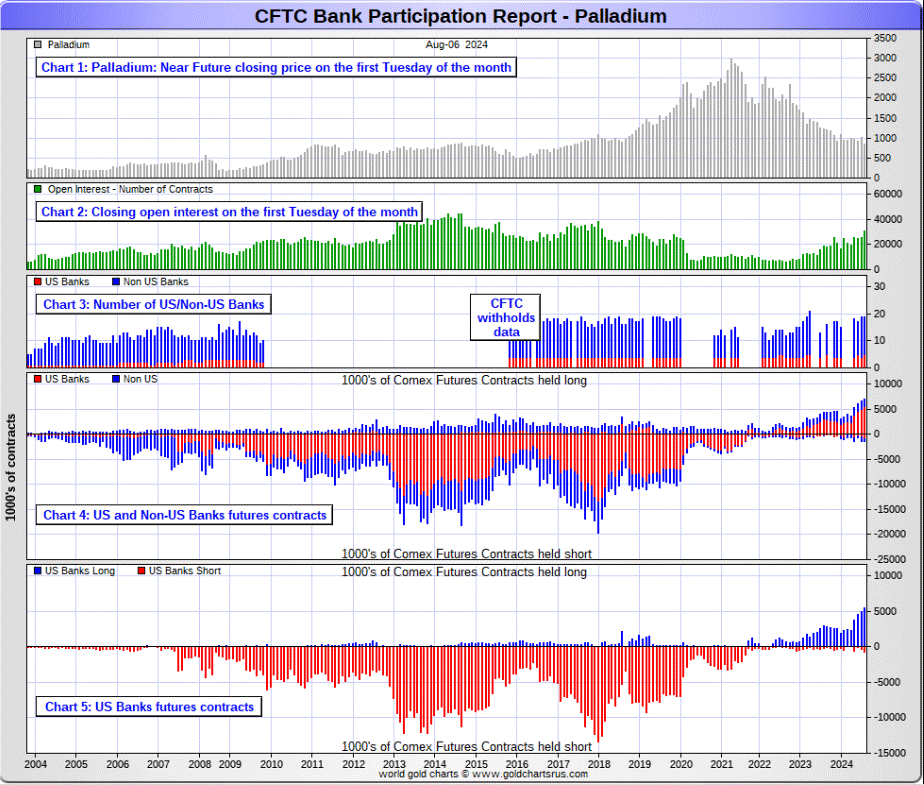
In palladium, 5 U.S. banks are net long another new record of 4,724 COMEX contracts in the August BPR, up a piddling 70 contracts from the 4,654 contracts that 4 U.S. banks were net long in the July BPR.
Also in palladium, 14 non-U.S. banks are net long 809 COMEX contracts, up from the 358 contracts that 15 non-U.S. banks were net long in the July BPR.
And as I’ve been commenting on for almost forever, the COMEX futures market in palladium is a market in name only, because it’s so illiquid and thinly-traded. Its total open interest in yesterday’s COT Report was only 30,871 contracts…compared to 81,153 contracts of total open interest in platinum…147,537 contracts in silver — and 480,645 COMEX contracts in gold.
But I should point out that open interest in palladium has been on a slow but steady increase over the last few years, because I remember when it was less than 9,000 contracts. So it’s nowhere near as illiquid as sit used to be.
As I say in this spot every month, the only reason that there’s a futures market at all in palladium, is so that the Big 8 commercial traders can control its price. That’s all there is, there ain’t no more.
As of this Bank Participation Report, 19 banks [both U.S. and foreign] are net long 17.9 percent of the entire COMEX open interest in palladium… down a bit from the 19.7 percent of total open interest that 19 banks were net long in the July BPR. The reason that the percentage is down and not up, is because of the increase in total open interest during the month, which obviously affects the percentage calculation.
For the last 3+ years, the world’s banks have not been involved in the palladium market in a material way. And with them still net long, it’s all hedge funds and commodity trading houses that are left on the short side. The Big 8 commercial shorts, none of which are banks, are short 40.4 percent of total open interest in palladium as of yesterday’s COT Report.
Here’s the palladium BPR chart. Although the world’s banks are net long at the moment, it remains to be seen if they return as big short sellers again at some point like they’ve done in the past.
Excluding palladium for obvious reasons, and almost all of the non-U.S. banks in gold, silver and platinum…only a small handful of the world’s banks, most likely no more than 5 or so in total — and mostly U.S.-based…along with the BIS most likely…continue to have meaningful short positions in the other three precious metals.
As I pointed out above, some of the world’s commodity trading houses and hedge funds are also mega net short the four precious metals…far more short than the U.S. banks in some cases. They have the ability to affect prices if they choose to exercise it…which I’m sure they’re doing at times. But it’s still the collusive bullion banks at Ground Zero of the price management scheme.
And as has been the case for years now, the short positions held by the Big 4/8 traders is the only thing that matters…especially the short positions of the Big 4…or maybe only the Big 1 or 2 in both silver and gold. How this is ultimately resolved [as Ted kept pointing out] will be the sole determinant of precious metal prices going forward.
The Big 8 commercial traders continue to have an iron grip on their respective prices — and it will remain that way until they either relinquish control voluntarily, are told to step aside…or get overrun.
Considering the current state of affairs of the world as it stands today — and the structural deficit in silver — and now most likely the other three precious metals as well, the chance that these big bullion banks and commodity trading houses could get overrun at some point, is not zero — and certainly within the realm of possibility if things go totally non-linear, as they just might.
But…as Ted kept reminding us from time to time…if they do finally get overrun, it will be for the very first time…which obviously wasn’t allowed to happen this past week, either.
The next Bank Participation Report is due out on Friday, September 6.
Shared by Golden State Mint on GoldenStateMint.com


