Source: www.stockcharts.com
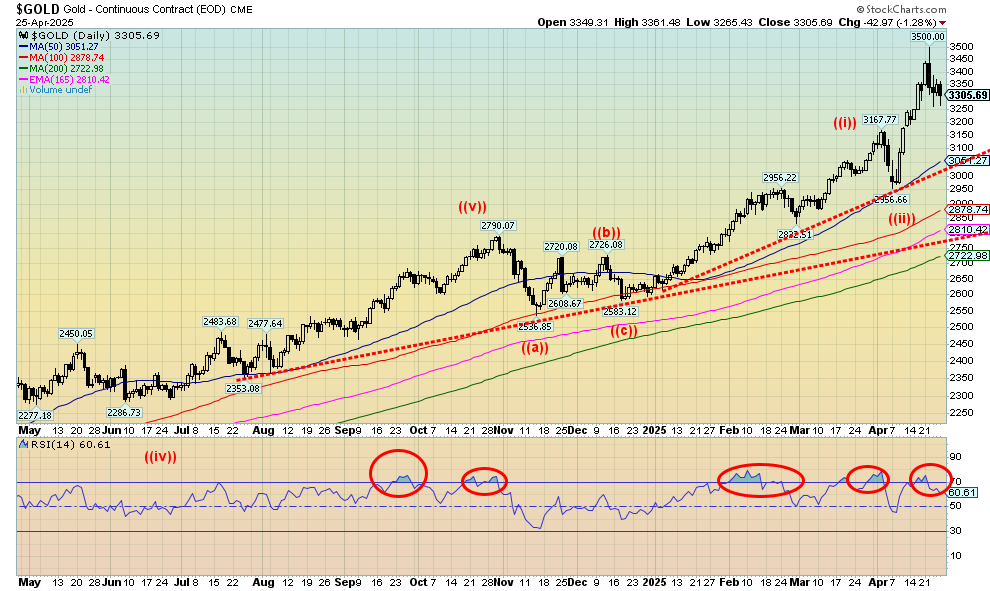
How do you read this week’s action for gold prices? Once again, we saw a new all-time high for gold, this time getting over $3,500, a number unheard-of only a year or two ago. But all the volatility with on-again, off-again tariffs and the ever-changing mind of President Trump sparked the spike, then a scary reversal. No, the reversal was not a key reversal week; meaning, new all-time highs, a collapse below the low of the previous week, and a close below the previous week. Instead, it left what we call a huge doji candlestick on the weekly charts. Meaning, we made a high a low and in the middle with the open ($3,348) and close ($3,319) close to each other. That normally signals a hesitation but not a potential major top. However, the pattern rarely signals a major top. Our key point to watch becomes $2,950 as we would not want to see that level broken. That would signal to us that we may have made a significant top. Support can be found down to the $3,250 and then $3,050. A 10% or so correction is not unusual. We are coming down from overbought levels and a period of eurphoia for gold. Buy the rumour: continued tariffs, firing of Powell, inflation from tariffs, global recession. Sell the news: tariffs keep changing, trade deals are being struck (but no evidence), Powell is not being fired, inflation is to be determined, and the global recession is not yet here. Therefore, take profits and sit on the sidelines.
Gold was down 0.6% on the week after all the gyrations. For a change, silver outperformed, gaining 1.6%. Platinum can’t seem to find its way and was up a tiny 0.2%. Palladium fell 2.3% but copper rose 3.0%. The gold stocks wavered and fell with the Gold Bugs Index (HUI) down 2.6% and the TSX Gold Index (TGD) off 3.7%. The HUI made 52-week highs before reversing.
We expect that gold should continue higher. But we are moving into a seasonal period where gold tends to be weak. This weak period can last into June/July before another advance gets underway. Only new all-time highs for gold, new highs for silver over $35, along with new highs confirming from the HUI and TGD will tell us the current correction is over. Otherwise, be prepared for at least a soft period with the potential for a 10% correction for gold. That would take us to $3,150. But we don’t want to see a break of $2,950 as that would signal a steeper correction and even a bear market.
Source: www.stockcharts.com
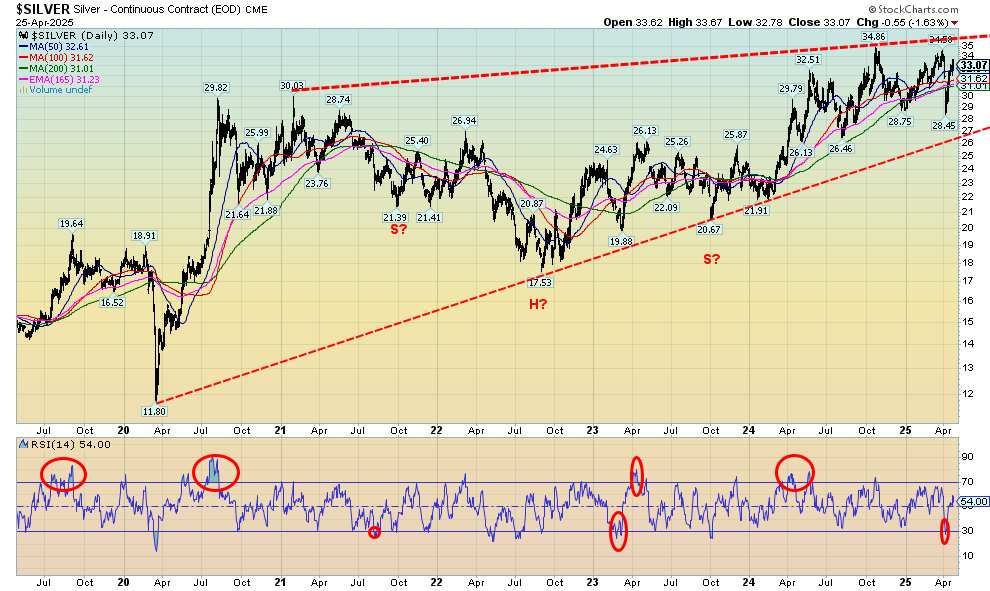
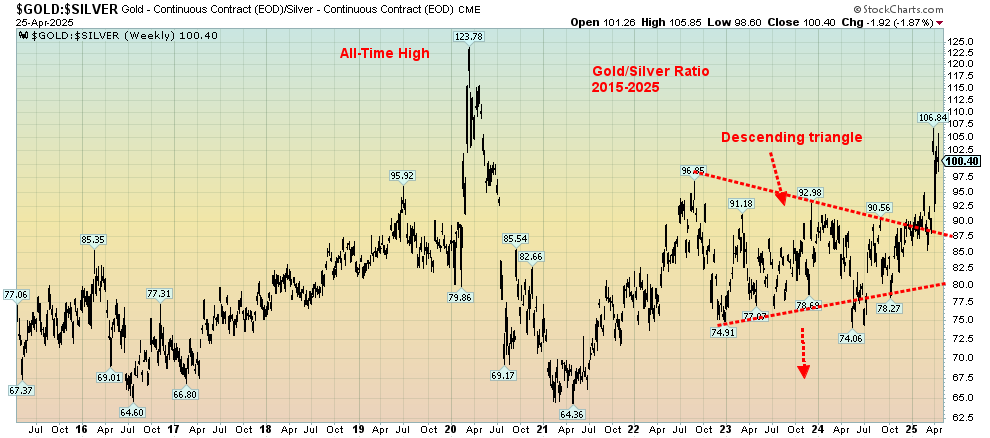
For a change, this past week silver took a lead role, gaining 1.6% to gold’s loss of 0.6%. Silver has been very frustrating. An industrial metal as well as a monetary metal, it is governed by the huge futures market that is three, four times the size of the physical market. While gold consistently makes new all-time highs, silver can’t even take out recent highs near $35. We had noted before the potential head and shoulders pattern that appeared to form in 2021/2022. But it was a very awkward one and may not fulfill its look the way we would like. Why? Because the right shoulder was below the left shoulder when it should be the other way around. The targets appeared to be up around $38/$39, but so far all we’ve managed is a high of $34.86. Worse, we appear to be forming a potentially bearish huge ascending wedge triangle. It breaks down under $27. Could it happen? Yes. Will it happen? That’s less clear as the going forward outlook remains bullish. Taking out $35 would go a long way to giving the bulls the upper hand. The gold/silver ratio hit a recent high of 106.84, marking only the second time the ratio went over 100. In the 2020 pandemic crash, the gold/silver ratio hit an unheard-of level of 123.78, then when the rally got underway it fell to 64.36. An incredible run. In 2011, at the top of the market for precious metals it fell to 31.14. That was when silver hit $50 and gold $1,900. But since then it has been all gold and we’ve gone through 10 years of gold outperforming silver. In nature, the gold/silver ratio is supposed to be around 15%. The Romans set the ratio at 12:1. Our suspicion is that the ratio may have seen its top. But confirmation is needed with silver breaking out over $35 and the ratio falling below 80.
Gold Silver Ratio 2015-2025
Source: www.stockcharts.com
Source: www.stockcharts.com
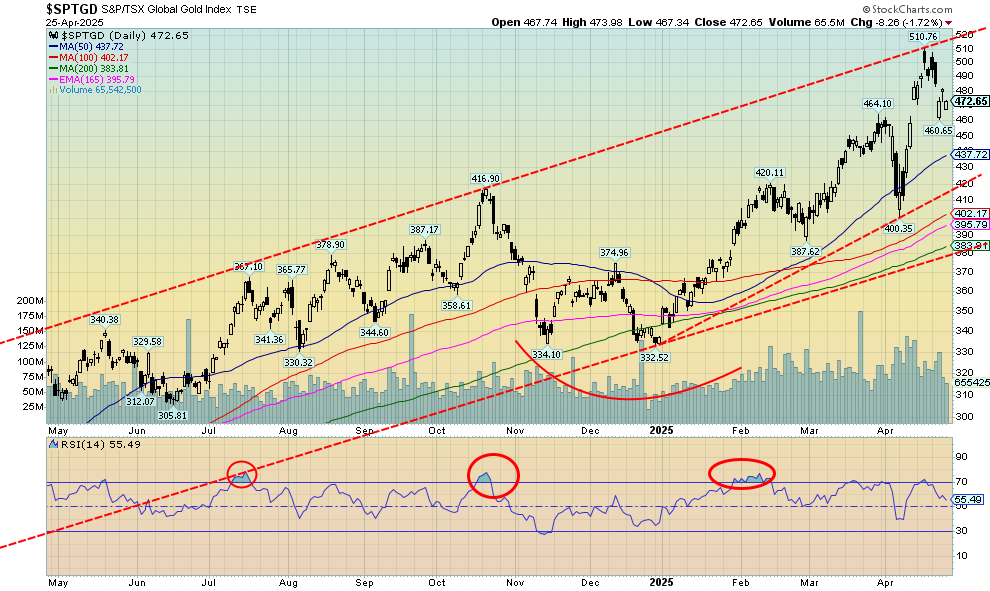
It probably is no surprise that, with the gyrations of gold prices this past week, profit-taking took hold with the gold stocks. This past week the TSX Gold Index (TGD) fell 3.7% while the Gold Bugs Index (HUI), despite making new 52-week highs, fell 2.6%. A key reversal week? That’s a hard call as we did make new weekly highs followed by the downside reversal and lows below the previous week. However, we did not close below the lows of the previous week so it was a reversal but probably not a key reversal. Nonetheless, it does signal a possible correction period for the gold stocks. Despite the fall, the TGD remains up 40.3% on the year while the HUI is up 41.2%. A normal 10% correction would leave both indices still quite positive on the year. During the 2009–2011 bull market there were four corrections over 10% and up to 25%. Yet the HUI rose 325% during the period.
Nonetheless, that channel line near 420 or, being more optimistic, the 50-day MA near 437 could easily beckon. A reminder that the correction that took place last year between October high and the December saw the TGD lose 20%. Even that swift drop in March 2025 saw the TGD fall almost 14%. It then quickly recovered. Since the pandemic low in March 2020 the TGD has gained 173%. From the last major low in 2015 the TGD is up 313%. But it has been very choppy with sharp gains in 2016 and 2019/2020, followed swiftly by big drops in 2017/2018 and 2020/2022. Such is the nature of the gold stocks. A drop now below 460 most likely could send us down towards 420/430. Major support lies near 385 with interim support near 400.
Disclaimer
David Chapman is not a registered advisory service and is not an exempt market dealer (EMD) nor a licensed financial advisor. He does not and cannot give individualized market advice. David Chapman has worked in the financial industry for over 40 years including large financial corporations, banks, and investment dealers. The information in this newsletter is intended only for informational and educational purposes. It should not be construed as an offer, a solicitation of an offer or sale of any security. Every effort is made to provide accurate and complete information. However, we cannot guarantee that there will be no errors. We make no claims, promises or guarantees about the accuracy, completeness, or adequacy of the contents of this commentary and expressly disclaim liability for errors and omissions in the contents of this commentary. David Chapman will always use his best efforts to ensure the accuracy and timeliness of all information. The reader assumes all risk when trading in securities and David Chapman advises consulting a licensed professional financial advisor or portfolio manager such as Enriched Investing Incorporated before proceeding with any trade or idea presented in this newsletter. David Chapman may own shares in companies mentioned in this newsletter. Before making an investment, prospective investors should review each security’s offering documents which summarize the objectives, fees, expenses and associated risks. David Chapman shares his ideas and opinions for informational and educational purposes only and expects the reader to perform due diligence before considering a position in any security. That includes consulting with your own licensed professional financial advisor such as Enriched Investing Incorporated. Performance is not guaranteed, values change frequently, and past performance may not be repeated.
Shared by Golden State Mint on GoldenStateMint.com