Excerpt from this week’s: Technical Scoop: Possible Reversal, Golden Roars, Pummeled Dollar
Amongst all this gloom, one thing has been shining. Gold! It gives credence that when everything else seems to be coming apart, the one thing that goes up is gold. Gold is the safe haven in times of geopolitical tensions, economic uncertainty, and loss of faith in government. It is also a hedge against currency gyrations as gold, unlike equities, bonds, and currencies, has no liability. Our 100-year chart of the Dow Jones Industrials (DJI)/Gold ratio shows that we are barely below the peak of 1929. The odds would appear to favor this ratio declining further in favor of gold. Bottoms were seen in 1933 (Great Depression), 1980 (the inflation 1970s), and more recently in 2011 (Great Recession).
No, gold does not go straight up. Indeed, we continue to be concerned about the fact that silver, which should be leading, is lagging badly. Not only is it nowhere near its all-time highs, but it remains below the highs of the past few months. The gold stocks, as represented by the Gold Bugs Index (HUI) and the TSX Gold Index (TGD), are finally breaking out to new highs and for the TGD new all-time highs. Overall, however, gold stocks remain cheap when compared to gold and the junior miners, as represented by the TSX Venture Exchange (CDNX), are at depressive levels. This situation shouldn’t remain for much longer. The note of caution, at least in the near term, is that the divergence between gold and silver is of concern. We noted that as well with the divergence between the DJI and DJT. The DJI and DJT are resolving that divergence, as both made 52-week lows this past week. Heavy buying of gold has particularly been seen in China.
Overall, commodities should be rising over the next few years, even as economic activity is disrupted and shortages develop. Commodities shone during the period of the Great Depression and the inflationary 1970s and more recently during the 2000s as we suffered through the dot.com crash and the financial crisis. The chart of the Dow/Gold ratio is breaking down in favor of gold. With both bonds and equities falling, along with housing prices and other assets, it is a matter of when, not if, the broader population including portfolio managers starts paying attention to the rise in gold. From a low in 1976 to the high in 1980, gold soared some 800%. A comparable run today could in theory take gold to around $8,000. There is too much debt in the world and one way to deal with it is a revaluation of gold. The U.S., with some 261 million ounces of gold, would need to revalue its gold holdings to at least around $14,000 to equal roughly 10% of its current debt of $36.7 trillion.
Dow/Gold Ratio 1925–2025
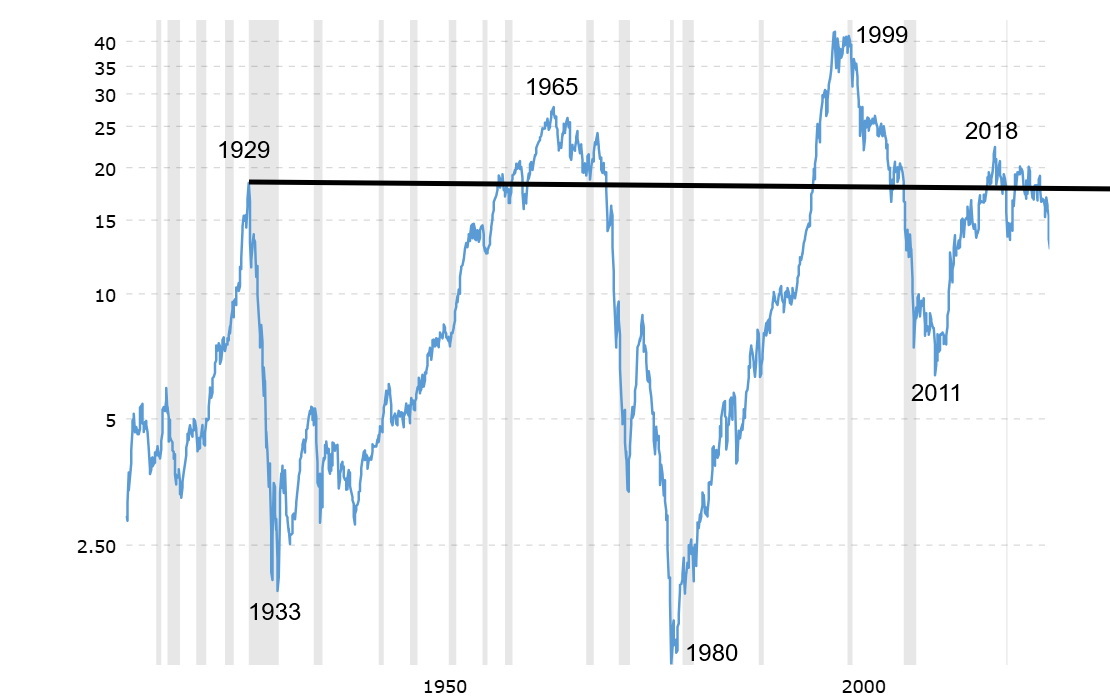
Source: www.macrotrends.net
Our note of caution on gold is it may be getting a bit frothy. A lot more attention is coming its way. We do appear to have overthrown that upper trendline. Is it a real breakout? Or a false move? We are not quite overbought, but we could be diverging with the previous high with a higher price but lower RSI. These divergences are not unusual, but one should proceed with caution from here. As we saw in the past week alone, we had a sharp down in the early part of the week but whipsawed back up over the past few days. There is a lot of uncertainty in the market and a lot of fear. A reversal again on tariffs could spark the stock market higher, but gold might react the opposite way, especially if the US$ Index were to rally from its current oversold condition. Regardless of any short-term gyrations, gold is going higher.
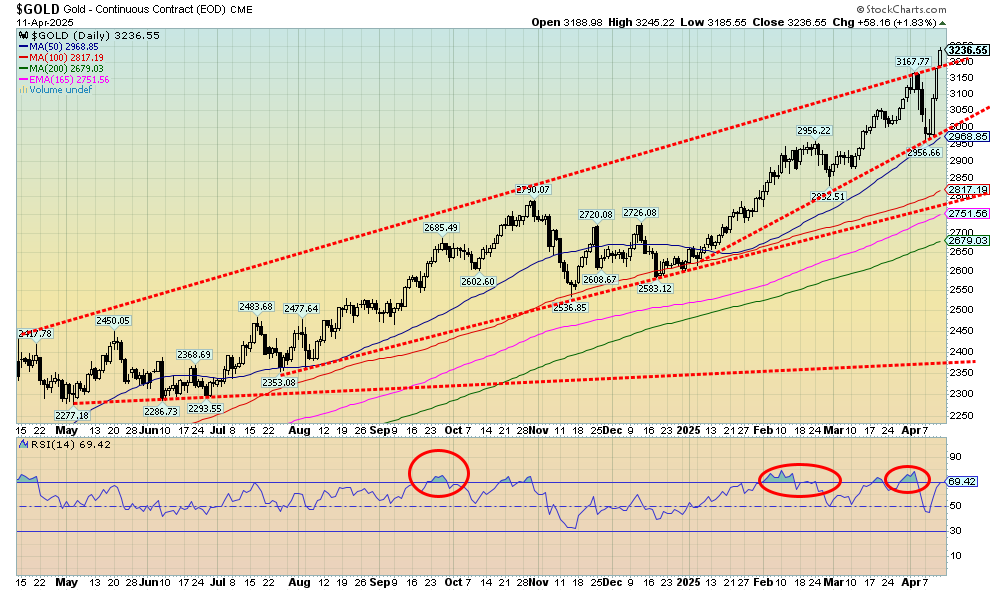
Source: www.stockcharts.com
We promised chaos and volatility in our forecast edition in December 2024. So far, we have not been disappointed. Batten down the hatches but own a bit of gold.
The Scorecard
We continue to monitor performance from the November 5, 2024 election. Gold remains solidly in the lead up 18.3%. As to rest? The S&P 500, US$ Index, WTI oil, momentum stocks and emerging market stocks are now all down in 2025. Yes, Bitcoin remains up but its slowing fading.
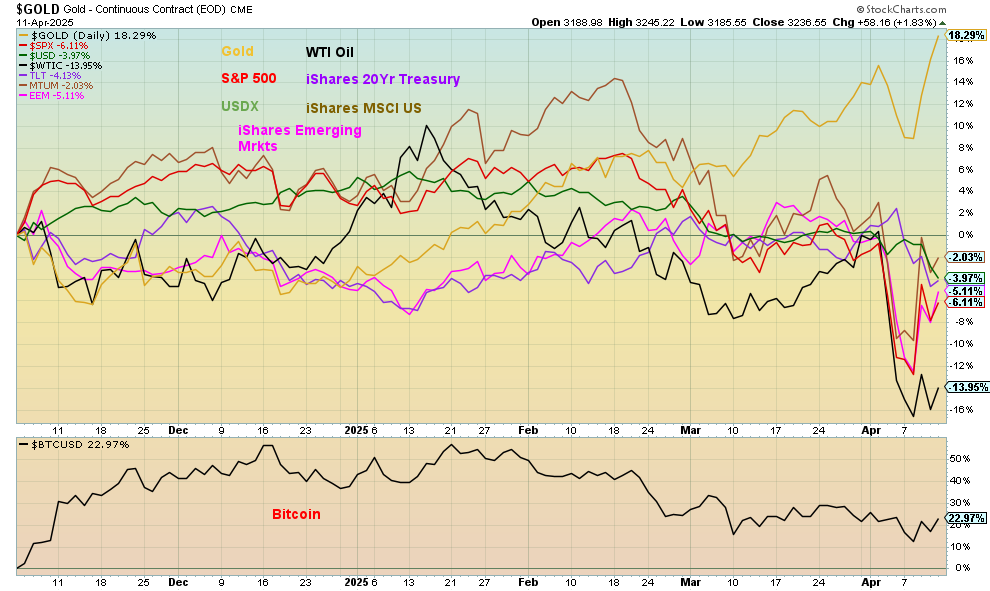
Source: www.stockcharts.com
Disclaimer
David Chapman is not a registered advisory service and is not an exempt market dealer (EMD) nor a licensed financial advisor. He does not and cannot give individualized market advice. David Chapman has worked in the financial industry for over 40 years including large financial corporations, banks, and investment dealers. The information in this newsletter is intended only for informational and educational purposes. It should not be construed as an offer, a solicitation of an offer or sale of any security. Every effort is made to provide accurate and complete information. However, we cannot guarantee that there will be no errors. We make no claims, promises or guarantees about the accuracy, completeness, or adequacy of the contents of this commentary and expressly disclaim liability for errors and omissions in the contents of this commentary. David Chapman will always use his best efforts to ensure the accuracy and timeliness of all information. The reader assumes all risk when trading in securities and David Chapman advises consulting a licensed professional financial advisor or portfolio manager such as Enriched Investing Incorporated before proceeding with any trade or idea presented in this newsletter. David Chapman may own shares in companies mentioned in this newsletter. Before making an investment, prospective investors should review each security’s offering documents which summarize the objectives, fees, expenses and associated risks. David Chapman shares his ideas and opinions for informational and educational purposes only and expects the reader to perform due diligence before considering a position in any security. That includes consulting with your own licensed professional financial advisor such as Enriched Investing Incorporated. Performance is not guaranteed, values change frequently, and past performance may not be repeated.
Shared by Golden State Mint on GoldenStateMint.com