 Balefire9/iStock via Getty Images
Gold is now in vogue among investors and mainstream financial media. The metal has captured much attention as it recently surged to a new all-time high of $2,488. It is trading at about $2,400 as of this writing, up 18% YTD. And it has gained 47% since bottoming at 1628 in October 2022. I have read many commentaries in financial media citing strong central bank buying as a key reason for gold’s surge and as a signal for more gains ahead.
However, these developments made me skeptical. In my view, none of the articles considered central bank buying in the proper context. More specifically:
- How much have central banks bought relative to the total gold tradable market cap?
- How much have they bought relative to total trading volume?
- How useful has their buy/sell behavior been as an indicator of gold’s current and future price trend? In other words, are the central banks “smart money,” as many would have us believe?
Answers to these questions took considerable research and calculations. Publicly available data are inconsistent.
The data I mined (pun intended) surprised me. I had to check the numbers several times. Surprisingly, the best data I could find shows the thesis of central bank gold buying as a reason for the rally is in doubt, if not outright wrong. There is even evidence that central bank gold buying has served as a good contrarian indicator.
Central Bank Gold Buying – The Numbers Do Not Explain the Rally
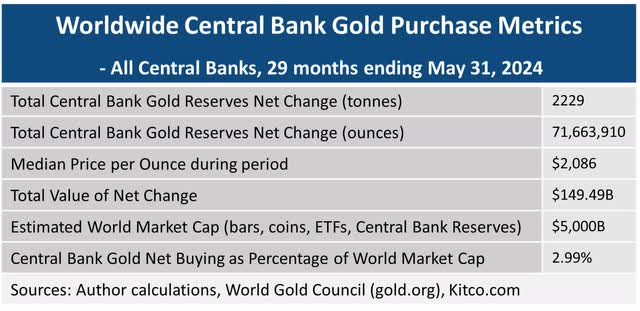
Let’s begin with a look at central bank gold net purchases as a percentage of total tradable market cap. The table below depicts key metrics gleaned from the World Gold Council website, which I believe is the most authoritative publicly available source. Worldwide central banks added a net 2,229 tonnes, or 71,663,910 ounces to their gold reserves during 2022-2023 and the first five months of 2024. As an aside, Bullion Vault data shows a much lower number for net purchases, by about 50%. Therefore, the net purchase metrics below may be overstated.
Author, World Gold Council, Kitco
The data show that over the past two and a half year buying spree, central banks accumulated $172.293B, or 2.99% of the total tradable gold market cap of $5 trillion. It is hard to see how this would move the price needle much, especially given bank purchases were spread out over two and a half years.
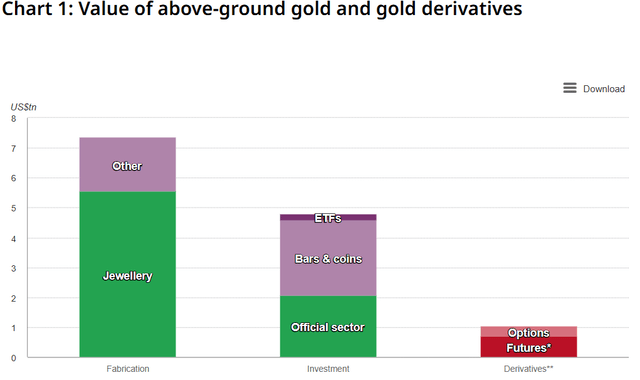
Another gauge is total net purchases relative to the total gold market. The chart below shows the distribution of all gold assets in the world. The total is approximately $12 trillion according to the World Gold Council. The central bank share of the total is about 17%. Their buying during the period equals 1.2% of the entire gold market.
In terms of their own reserves, banks tacked on 7.4% of their total of approximately $2 trillion (at year-end 2022). That means the banks added about 3% per year to their total reserves during the past 29 months. Again, this is not a spectacular number when placed in this context.
World Gold Council
Central Bank Gold Buying Relative to World Market Liquidity
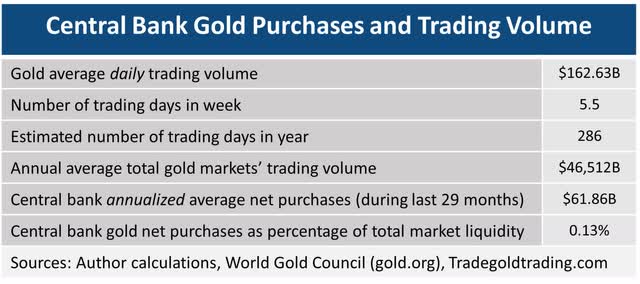
Next, let’s look at central bank buying versus total trading volume. If central banks were buying large sums relative to what is available on major trading exchanges, it would drive up prices. The table below shows the relevant metrics.
 Author, World Gold Council, Tradegoldtrading.com
During the last 29 months, central banks accumulated gold at an average of about $61B per year. That compares with annual average trading volume (using 2023 data of $162.63B per day) of about $46,512B or $46.5 trillion.
Hence, central banks purchased only 0.13% of total annual liquidity. Another way to look at it is that during an average 12-months of one of the most aggressive buying sprees ever, central banks bought a little more than one-third of the daily world gold trading volume.
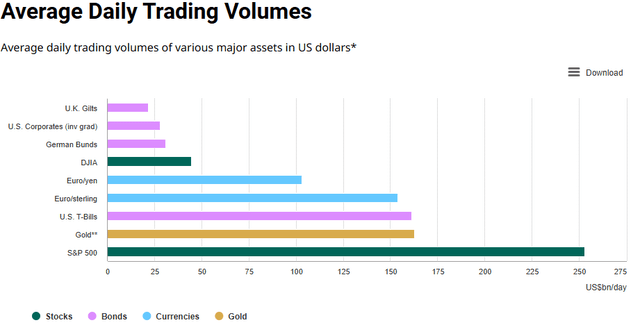
These numbers surprised me. After more digging, I found the chart below. It shows gold is the second most liquid asset – behind the S&P 500 and ahead of the highly liquid U.S. T-bill market. It supports the idea that central bank buying has less impact on the market than we expect.
 World Gold Council
Indeed, the World Gold Council states:
The size of the market allows it to absorb large purchases and sales from both institutional investors and central banks without resulting in price distortions. And in stark contrast to many financial markets, gold’s liquidity has not dried up, even during times of financial stress, making it a much less volatile asset.”
This further supports the idea that central bank transactions have less much impact on gold’s price than most financial media suggest.
Central Banks Are Not Smart Money
Now let’s turn to the question of whether one should follow central bank buying and selling to inform investment decisions.
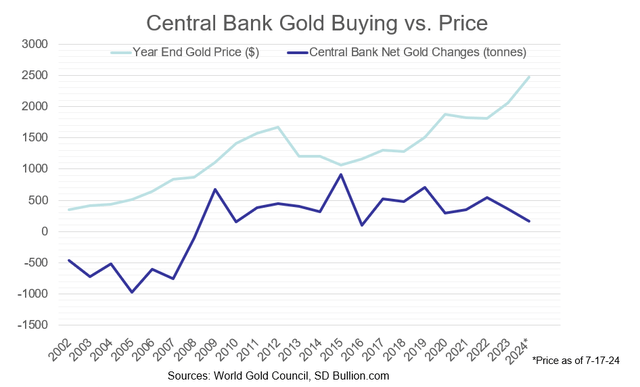
Many gold pundits frequently tell us that central banks are “smart money.” Yet, once again, the data tell a different story. The chart below shows the total world central bank net gold purchases versus the year-end gold price since 2002.
 Author, SD Bullion, World Gold Council
Here are takeaways regarding how central banks fared with their buying and selling decisions:
- From 2002 through 2008, central banks were consistent net sellers of gold while the metal more than doubled from $343 to $865. Central banks proved to be a good contrarian indicator of gold’s direction. Furthermore, their selling failed to deter gold’s strong advance.
- In 2009, banks loaded up and added a net of 676 tonnes. Gold increased to $1,104 by year-end. Central banks were smart money.
- From 2010 through 2012, central banks added a cumulative 987 tonnes while gold went to $1,664 for a gain of $471. Central banks were smart money.
- From 2013 to 2015, the banks added a whopping 1,636 tonnes. They accelerated purchases at the top during 2015, adding 913 tonnes. Yet, gold dropped that year from $1,199 to $1,062. Central banks were a good contrarian indicator. Gold declined despite strong central bank buying.
- After gold bottomed in 2015, central banks had less enthusiasm, adding less than average, or 104 tonnes in 2016. Yet, by the end of 2017 gold advanced to $1,296. The banks added 523 tonnes that year, helping to fuel the advance. Yet gold was flat again in 2018 and ended the year at $1,282. Banks were not smart money.
- Central banks added 1,475 tonnes during 2018-2020, while gold went to $1,878 for a gain of 45%. This could have been a causative factor for the gains. The banks were smart money.
- From 2021 – May 2024 central banks added a whopping 2,679 tonnes. During that time, gold rallied to its current level of about $2,400. However, as shown above, the purchase volume represented a small percentage of the market. The banks were smart money.
In the seven sub-periods we examined, central banks proved to be smart money in four cases. They were not smart money in three cases. in fact, the latter included a seven-year period and a three-year period when they were a contrarian indicator. Out of the twenty-two and half years examined, the central banks were on the correct side of the market for 12 years, neutral during one and wrong during 10. That is a little better than a coin flip, but hardly smart money. Further, the data suggests their buy and sell decisions had negligible or at least inconsistent effect on gold’s price.
Astonishment and Problems
Admittedly, I was astonished by these findings. I had to check my numbers several times. Almost everything I have read over many years supports the belief about central banks’ strong influence on the gold market. There is one exception. I credited Robert Prechter’s Socionomic Theory of Finance in the comments section of one of my earlier articles. Prechter called out central bank actions in the early 2000s as a contrarian indicator.
How can it be that central banks have a negligible impact on the gold market? The data above might be wrong. It is very possible central banks have bought much more gold than they have admitted to. Most believe that Russia and China have not been honest with their reporting. To be sure, Bullion Vault noted:
Many analysts believe China’s national gold bullion holdings are larger than the reported total, perhaps twice the size if you compare the country’s visible private-sector demand against its gold mining output and bullion imports. The excess supply must have gone somewhere, and the People’s Bank has in the past kept the changes in its gold holdings a secret, suddenly announcing huge increases in its gold reserves in 2009 and 2015.”
Another possibility is that options and futures traders sometimes manipulate the market. There are prominent gold experts who fervently believe this. However, gold is a vote of no confidence for fiat currencies. Its success undermines the goals of central banks who want stable currencies. Therefore, if anything, central banks would be inclined to depress gold’s price rather than fuel its advance.
It is also possible that I am missing something in my analysis. There are many smart readers on SA, so I welcome your insights!
Why I Own Gold: An Effective Component of an All-Weather Portfolio
Regardless of the actual numbers, I don’t own gold because central banks are accumulating it.
Those who follow me know I utilize an all-weather portfolio approach. Gold is a core holding, with a 15% allocation in my portfolio. I have owned it for more than a decade and will continue to hold it for the long run. Previous SA articles, including my all-weather portfolio articles, provide more details. For those who want the highlights, here is a recap:
Solid long-term returns. Since 2000 gold has returned 8.7% per year, outperforming the S&P 500’s return of 7.4%, per VanEck. Since 1971, after Nixon devalued the dollar, gold has returned 8.3% per year.
Excellent portfolio diversification. Since January 2000, gold’s correlation is 0.046 and 0.447 with U.S. equities and Global Treasuries ex-US respectively, according to the World Gold Council’s calculator. An Ibbotson study regarding the benefits of precious metals diversification stated:
“Based on the forward looking resampled efficient frontiers, asset allocations that include precious metals have better risk-adjusted performance (as measured by Sharpe ratio) than asset allocations without the precious metals. Investors can potentially improve the reward-to-risk ratio in conservative, moderate, and aggressive asset allocations by including precious metals with allocations of 7.1%, 12.5%, and 15.7%, respectively. These results suggest that including precious metals in an asset allocation may increase expected returns and reduce portfolio risk.”
An effective currency and debt hedge. Over the past 30 years, the correlation between the U.S. dollar and gold was -0.65. Another study found a high correlation of 0.93 between gold and U.S. debt from 1982-2010. The Financial Times interviewed Alan Greenspan in 2014. They asked, “Do you think that gold is currently a good investment?” Greenspan replied:
Yes, remember what we are looking at. Gold is a currency. It is still, by all evidence, a premier currency. No fiat currency, including the dollar, can match it.”
Long-term prospects. In 2022 with gold at $1940, I presented why gold could reach $5,000 in three to six years. I cited the monetary stock as a factor that could justify a much higher gold price. I also showed the Dow to Gold ratio, another sentiment measure that favored gold for the longer-term.
What Really Drives the Price of Gold – Sentiment
A final comment before wrapping up. For those who haven’t read it, I discussed the fallacies of using fundamentals to explain or predict gold’s price movements in Where is Gold Going? Watch Sentiment, Not Fundamentals. The data here on Fed gold buying further supports this thesis. As a result, I will continue to watch sentiment via the Commitment of Traders (COT) report and Elliott Wave Theory.
Conclusion
Central bank gold buying doesn’t appear to be as impactful nor relevant as many believe. But there are other very good reasons to own gold as part of a well-diversified portfolio. But it has experienced long periods of stagnation and at times can be volatile. As such, patience is required.
Shared by Golden State Mint on GoldenStateMint.com


