In this article, I will present evidence that shows it is highly likely the next US President will inherit a major recession and stock bear market. This is likely to dominate the early years of their administration, which will lower his or her popularity and make it difficult to implement their agenda.
In addition to being interesting, I hope this information will help investors who want to prosper during the challenging times ahead.
Betting Markets Currently Favor Trump
According to the table below from Real Clear Politics, betting markets are predicting Trump will likely win the Presidency with 58% odds. Harris is second with 33% odds, and Michelle Obama is a distant third with only 3% odds. Whoever wins the election will likely have a challenging time in their early years if there is a recession and bear market, particularly with the country already highly divided politically.
 Real Clear Politics
Presidential Economic Policies Are Not Likely To Prevent Recession
It is unlikely that the next President will have any major influence on the likelihood of a recession and bear market. If Trump is elected, he may try to implement higher tariffs, trade restrictions, and tougher immigration policies while trying to offset the negative impact of these policies on the economy by reducing regulations and lowering income taxes. Unfortunately, high-budget deficits and the huge government debt problem will likely persist, since neither party has a plan to restructure major entitlement programs like Social Security or Medicare, which is the key driver of long-term debt and deficits.
Federal Reserve Monetary Policy Drives Boom-Bust Business Cycle
Unlike Presidential fiscal policies, I believe Federal Reserve monetary policy is the key driver of the boom-bust business cycle. That is why Wall Street hangs on every word said by Fed Chair Jay Powell and his central planning colleagues.
According to the Austrian Business Cycle Theory, developed a century ago by Austrian economists Ludwig von Mises and F.A. Hayek, unsustainable economic booms are caused by central and commercial banks creating new money out of thin air. The inevitable busts occur when they slow money supply growth or, even worse, contract it.
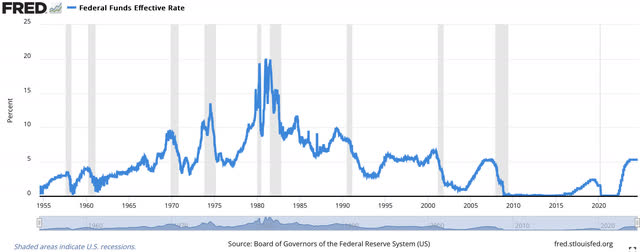
In response to the Covid panic of 2020, the Fed created 40% more US dollars. That led to the highest inflation rates since the early 1980s. That high “transitory” inflation forced the Fed to raise the Federal Funds interest rate by over five percentage points over the past couple of years, which is the biggest increase in over 40 years. Every time there has been a large increase in rates by the Fed, there has been a recession.
One of the Fed’s preferred inflation measures is “SuperCore CPI”, which is services inflation less shelter. SuperCore CPI rose 4.8% in June, which is 2.4 times higher than the Fed’s 2% target. This suggests the Fed should not be cutting rates anytime soon if they are serious about fighting the inflation they created, but I believe they will as unemployment rises and a recession becomes obvious.
For those investors who believe the Fed can prevent a recession with rate cuts at this point, I remind them that the Fed slashed rates all throughout the early 2000s and 2008-2009 recessions, but that failed to prevent them or their related stock bear markets.
The chart below shows the Federal Funds rate going back 70 years. It indicates that recessions (shaded gray) began after significant Fed rate hikes, including in the early 2000s, 2008-2009, and 2020. It also shows that the Fed has held rates at a similar level and for a similar year-long period as they did before the Great Recession. This is not a bullish chart for the economy.
 FRED
FREDYield Curve Inversion Always Precedes Recessions
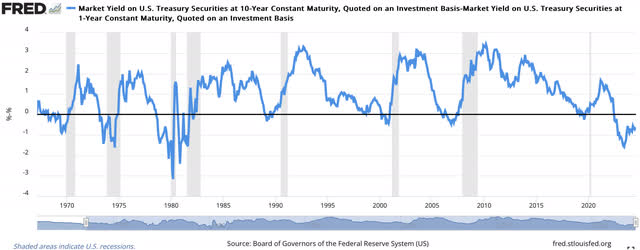
Due to the Fed rate hikes, short-term rates are higher than long-term rates, which is called an “inverted yield curve”. Every time the yield curve has been this inverted in the past 100 years, there has been a major recession. That includes the Great Depression of the 1930s. The 10-Year/1-Year Treasury yield curve has been inverted for the past two years, as shown in the chart below. That is longer than the 18 months of yield curve inversion before the Great Recession of 2008-2009. Historically, the longer the yield curve inversion, the longer the subsequent recession.
 FRED
FREDMoney Supply Has Been Declining
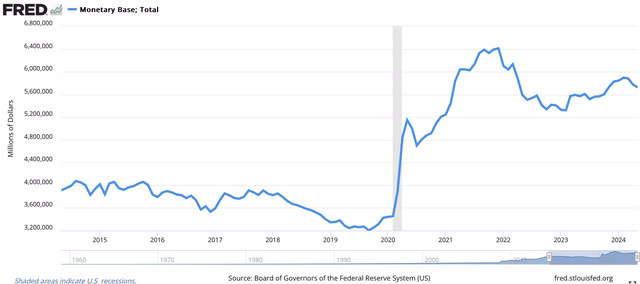
Due to the Fed’s tight monetary policies, the Fed’s Monetary Base (currency plus bank reserves) has declined 11% since December 2021, as this chart shows.
 FRED
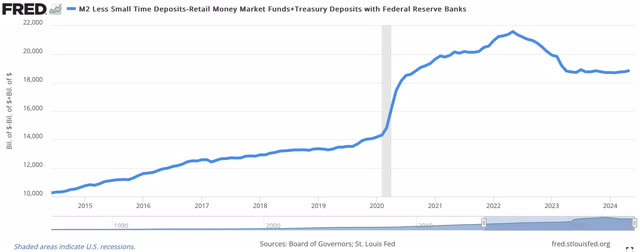
FREDThe popular M2 money supply has declined by 3.5% since March 2022. I believe a better money supply measure is one that does not double count and includes money that can be immediately spent. Based on the work of economist Murray N. Rothbard, this can be defined as M2 less small time deposits less retail money market funds plus Treasury Deposits with Federal Reserve Banks. This measure is down 12.7% since May 2022, as shown here. That is the biggest decline since the Great Depression.
 FRED
FREDHousing Demand Is In Recession
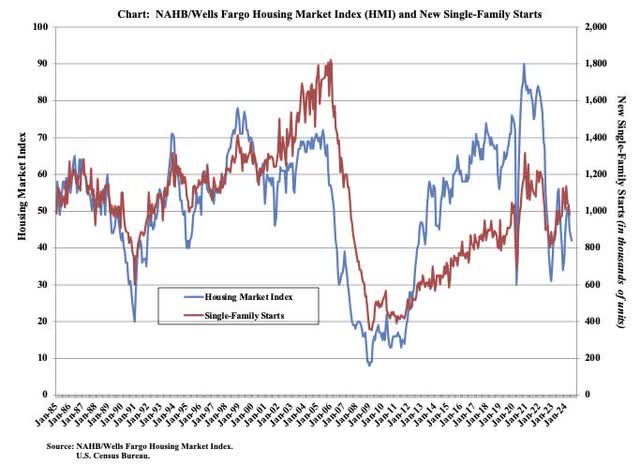
Housing demand is very sensitive to interest rates, which makes it an excellent leading economic indicator. Due to mortgage rates more than doubling over the past few years and very high home prices relative to incomes, buying conditions for homes are near the worst levels in history and housing demand is very weak.
As a result, the NAHB Housing Market Index (blue line in the chart below) has fallen to a level typically seen during recessions. In addition, housing starts (red line) are down 4.4% year-over-year.
 NAHB
NAHBManufacturing And PMIs Are In Recession
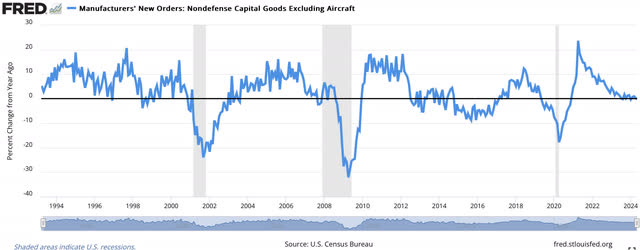
Manufacturing is also a proven leading economic indicator. As shown below, manufacturers’ new orders (ex-defense and aircraft) are declining -0.3% year-over-year. That is not an inspiring sign for the economy.
 FRED
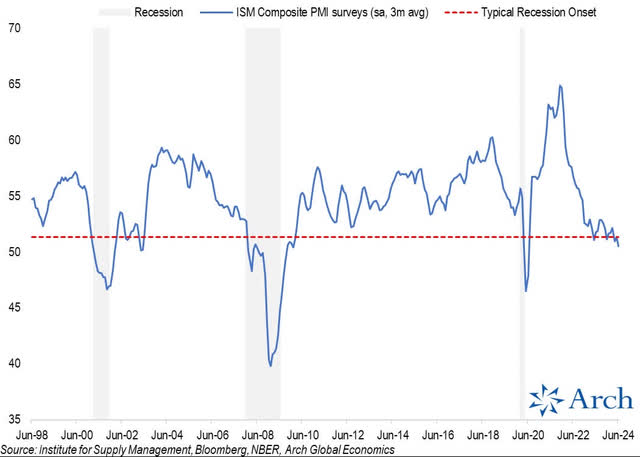
FREDThe composite of the ISM manufacturing and services purchasing manager indexes (“PMIs”) is below 51, which typically only occurs in a recession, as shown below.
 Arch Global Economics
Real Retail Sales Are Declining
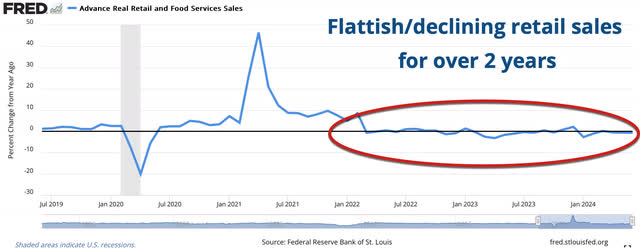
Declining real retail sales are a typical recession sign. In June, real retail sales fell 0.7%. As the following chart shows, real retail sales have been flattish or declining for more than two years. Imagine how much real retail sales can decline when unemployment starts rising significantly, as it typically does about two years after the yield curve inverts.
 FRED
FREDUnemployment Is Rising At A Recessionary Pace
Speaking of unemployment, there are numerous signs it is getting worse.
One sign is temporary job losses, which are a leading employment indicator since temporary workers are the easiest type of employee to lay off. Temporary job losses have totaled 515,000 since March 2022 and are falling at a rate only seen in recessions. That is also true of other leading employment indicators such as job openings, quits, and hires.
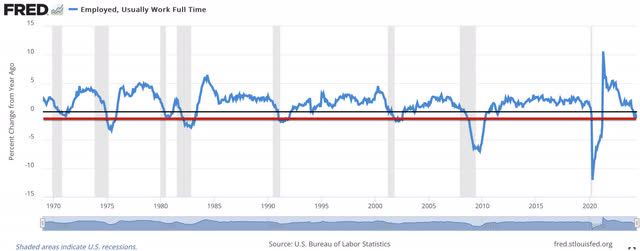
Another sign of a recession is declining full-time jobs. While part-time jobs have increased, a whopping 1.6 million full-time jobs have been lost over the past year. As this chart shows, full-time jobs are falling at a pace only seen around recessions.
 FRED
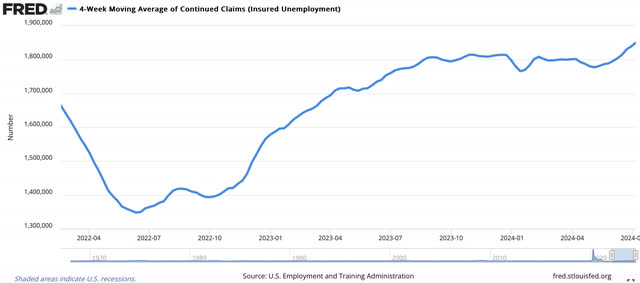
FREDHistorically, a recession has always occurred when the four-week moving average of continuing unemployment insurance claims rose 20% or more. So far, they have increased 37% from their lows in June 2022, as shown here.
 FRED
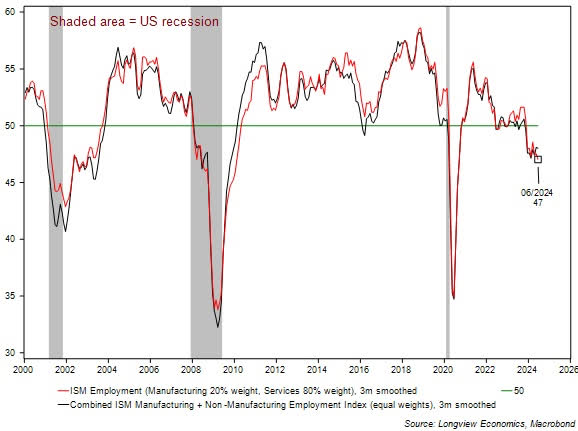
FREDAnother sign of a recessionary jobs market is the combined ISM manufacturing and services Employment Composite has been below the neutral 50 level for months, as shown here.
 Longview Economics
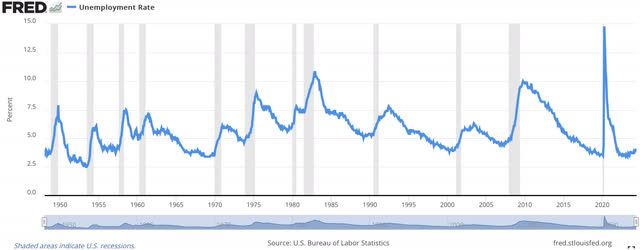
Perhaps the simplest and most useful employment indicator is the unemployment rate. Historically, whenever it has risen at least 0.5% from its lows, there has been a recession. So far, it has increased 0.7% from its low of 3.4% in 2023 to 4.1% now.
 FRED
FRED
Leading Economic Index Is Declining At A Recessionary Pace
The Conference Board’s Leading Economic Index is a composite of 10 proven leading economic indicators. As the chart below shows, it is declining -5% year-over-year. That is similar to the declines seen at the beginning of recent recessions.
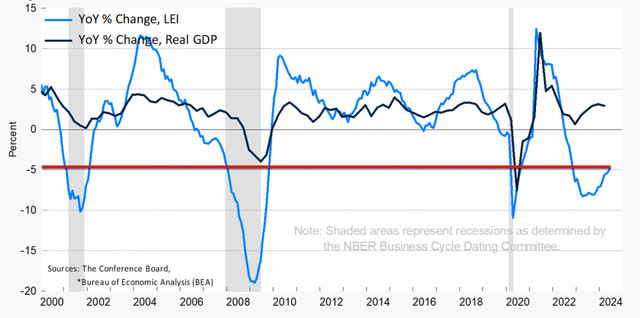 The Conference Board
Stock Market Valuation Is At All-Time High
What does a recession mean for the stock market, when we’re at the beginning of the “AI revolution”? Remember when Internet mania drove the stock market to such high valuations in 2000 that the NASDAQ ended up collapsing about 80% during the relatively brief and mild recession of the early 2000s?
The stock market always falls into a bear market during a recession. The higher the starting valuation, the deeper the bear market that usually follows.
As this chart from economist and fund manager John Hussman shows, the stock market is now at the highest valuation level in history…even higher than the valuations seen at the Tech Bubble peak of 2000 or even the 1929 peak.
This stock market valuation ratio (which is similar to Warren Buffett’s preferred valuation ratio: total stock market capitalization to GDP) has a century of accurately forecasting long-term (12-year) returns for the S&P 500 better than any other valuation metric. Based on this all-time high valuation level, the S&P 500 is likely to be at least 50% lower in 12 years.
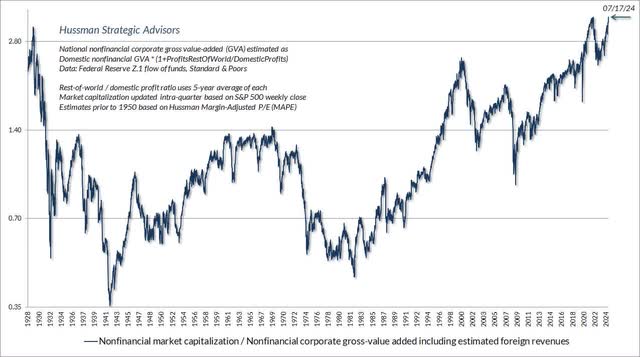 Hussman Strategic Advisors
What Can Investors Do?
With a new President likely to inherit a recession and bear market, what can an informed investor do?
The easiest strategy is to identify when the bear market is likely starting based on technical indicators and simply invest in Treasury bills or a money market fund and earn 5% interest risk-free.
I believe they can also consider investing in gold and silver. I recently argued that gold and silver are in a bull market uptrend that is likely to continue for a while.
For those investors willing to take on more risk in the goal of seeking higher returns during a bear market, they can buy inverse ETFs that rise in price when stocks fall, such as SH or PSQ.
I wish you the best of luck in navigating the challenging times ahead. Please let me know your thoughts in the comments below, so we can all continue learning from each other.
 adamkaz
Shared by Golden State Mint on GoldenStateMint.com


