 EC_Hallex
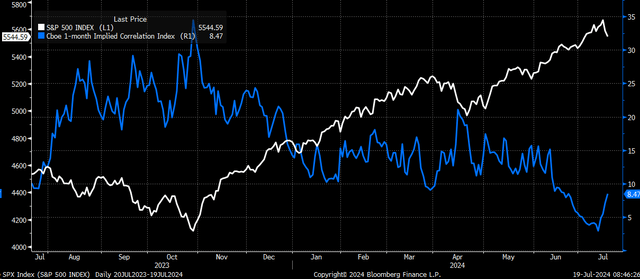
Equities have pulled back this week as rising realized and implied volatility have increased implied correlations. On July 12, the 1-month implied correlation index reached historic lows. Since then, the implied correlations have risen sharply but are still low by historical standards and are likely to rise more as we move through earnings season, and implied volatility levels rise as we move into the Presidential election.
The equity market stretched itself too thin in too many places, and it didn’t take much for the trends to snap. Realized volatility fell too low, and it took a little movement in the equity market to cause this all to start to unwind.
Volatility Rising
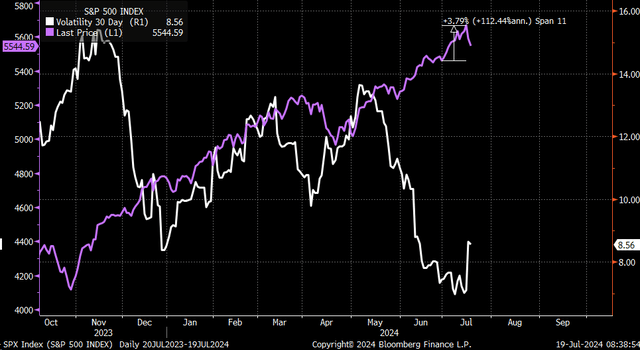
As noted back on June 27, realized volatility levels were relatively low, and the ability for the S&P 500 (SP500) to continue to see small gains over a protracted period seemed unlikely. 30-day realized volatility hit a low of 6.97 on July 9 and 7.01 on July 12. The rule of 16 suggested that the S&P 500 could not rise more than 0.44 bps per day or risk realized volatility starting to climb. That was working fine, but that was right around the realized volatility bottomed because a nearly 4% rally between June 28 and July 16 started pushing realized volatility higher.
 Bloomberg
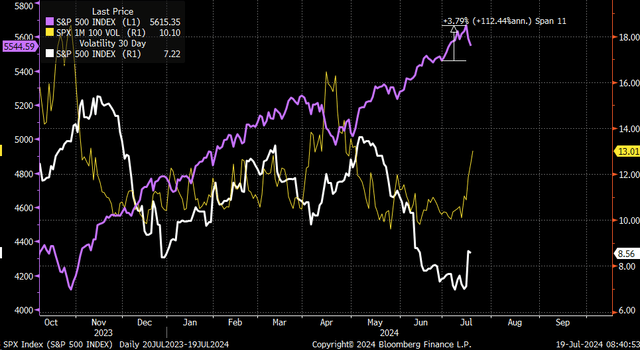
The rise in realized volatility became a bigger problem when implied volatility also started rising, with one-month at-the-money implied volatility rising from around 10.10 to 12.5 from July 12 to July 18. This type of movement in implied volatility, at a time when the volatility dispersion trade was in full force, doesn’t work particularly well.
 Bloomberg
Implied Correlations Rising
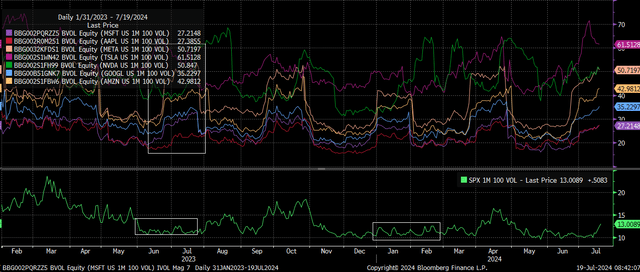
Implied correlations increase when the implied volatility for single stocks and the S&P 500 rises simultaneously, which has been happening for the last few days.
 Bloomberg
The issue is that next week’s earnings season is in full view, with Alphabet (GOOG) (GOOGL) and Tesla (TSLA) reporting results. Once those companies report results, implied volatility for those stocks will crash, as they always do post results. This means that even if implied volatility in the S&P 500 index comes down, implied correlations may not, because falling implied volatility in stocks and the S&P 500 index means implied volatility is becoming more correlated.
The stock market is in a tough spot currently because when implied correlations start to rise, it typically follows an equity market that is moving lower, which is precisely what is happening now.
 Bloomberg
Problems
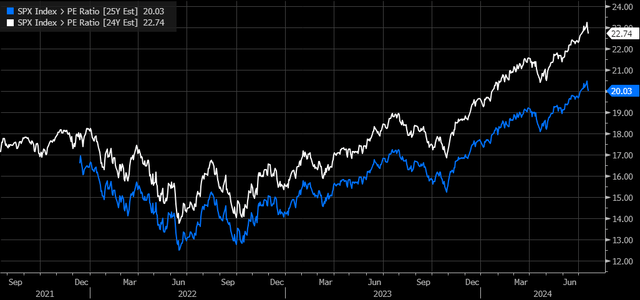
The same event happened last year, and it led to the index declining by around 10%. Now, this year is different, with a new set of problems. The biggest concern is that the S&P 500 trades at a much higher valuation. In July 2023, the S&P 500 peaked at 19 times 2024 earnings estimates; this year, it is trading at 20.0 times 2025 earnings estimates. So stocks are pricier on a 1-year forward basis.
 Bloomberg
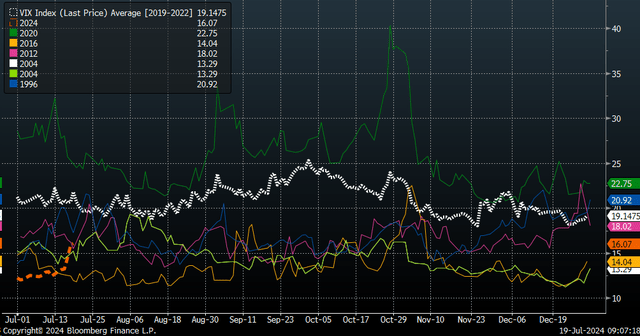
Additionally, it is an election year, and we typically see higher implied volatility overall in an election year. This year’s S&P VIX Index (VIX) has been tracking lower than the presidential election years, starting in 1996 and continuing through 2020, excluding 2008. That has changed some with the recent move higher, but seasonally, it would suggest that implied volatility is likely to move higher between now and the election.
 Bloomberg
This probably means that over the coming months, we will likely see realized and implied volatility continue to move higher, pushing implied correlations higher, which will most likely send the S&P 500 lower. Because mechanically, that is how this trade typically works.
It appears to be another instance of flying too close to the sun; now, as the wings melt, gravity seems poised to take over.
Shared by Golden State Mint on GoldenStateMint.com


